- Getting Started
- Control Panel
- Toolbars
- Chart Overlay Indicators
- Indicator Windows
- COT - Commitment of Traders
- PROB - Market Probability
- RBN - Ribbon
- SEAS - Seasonal Trend
- AD - Williams Accum/Dist "Williams Accumulation/Distribution"
- ATR - Average True Range
- %B - Percent Bollinger Bands
- BW - Bollinger Bandwidth
- CCI - Commodity Channel Index
- CMF - Chaikin Money Flow
- DMI - Directional Movement Index
- FSTO - Fast Stochastics
- GTR - Gator Oscillator
- HVOL - Historic Volatility
- KST - Know Sure Thing
- MACD - Moving Average Convergence/Divergence
- MFI - Money Flow Index
- MOM - Momentum
- OBV - On Balance Volume
- PPO - % Price Oscillator
- PVO - % Volume Oscillator
- %R - Williams' %R "Williams Percent R"
- ROC - Rate of Change
- RSI - Relative Strength Index
- SRSI - Stochastic Relative Strength Index
- SSTO - Slow Stochastics
- TRIX - Triple Exponential Average
- ULT - Ultimate Oscillator
- VOL - Volume
- Plug-Ins
- End User License Agreement(EULA)
- Gecko Software Risk Disclosure
You are here
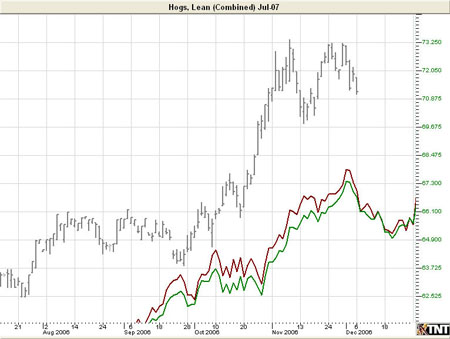
Historical Averages (HIST) Overlay
The Historical Average indicator is very similar to a Moving Average indicator, except that it is based on the average price of the specific contract lined up by date. The charts are made for specific contract months so that the trader can see the behavior of the specific contract they are looking at. This detail is important in a market with new and old crop contracts, such as the agricultural commodities.
Unlike the seasonal average prices, the Historic Average lines depicted in this feature are based on price, not a relative basis. In essence, what this feature does is give you the average price on a specific day. This chart will have the same basic feel and theme as the seasonal chart, except instead of prices being scaled on a relative basis (0 to 100%) they are the average historical price for that day.
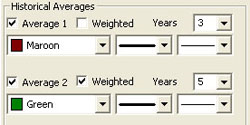
This feature helps traders to quickly see how current prices compare versus average historical prices over a given time period and also shows seasonal trends over the given historical years chosen. By simply checking the Average 1 and/or Average 2 checkbox(s) on within the Historical Averages chart overlay properties, it displays the average line(s) within the main chart window. You may also change the number of years, the color, and line style in which the indicator is displayed. The weighted box can be selected to provide more significance to the latter years than the earlier years. The un-weighted is a simple average, giving equal significance to each year included in the study.
Displaying the Historical Averages Overlay
To open the Historical Averages overlay right click on the chart and select Chart Overlays and then Historical Averages.
Example of Historical Averages:
Preferences
To open the Historical Averages Preferences click on the QuickLink (HIST) in the lower right of the chart. Or you can right-click, select Overlay Properties and then Historical Averages. If you click on the chart, the Preferences tab will go back to chart settings.
 Restore Settings: TNT Default will change your settings back to the original software settings. My Default will change current settings to your personalized default settings. Update All HISTs will apply your selected settings on all open charts. Save As My Default will save your current personal settings.
Historical Averages: Select which averages you would like to view, if you would like them Weighted, and how many years you would like to see. Choose the color, line style, and line thickness of your indicator line.