You are here
ATR - Average True Range
The Average True Range Indicator was developed by Welles Wilder to work with the commodity industry. The purpose of the ATR is to recognize the level of volatility in a market.
Volatility is a measurement of the change in price over a given period. It is often expressed as a percentage and computed as the annualized standard deviation of the percentage change in daily price.
When a market is going sideways, it typically exhibits low volatility and is difficult to trade. A market with higher volatility is typically trending better which would produce more opportunities to get into a trade. If a market’s volatility is too high, traders find that the market is too erratic, and it becomes difficult to trade. In using the ATR, traders hope to measure the level of volatility to help them interpret the different markets they are watching. It is important to remember to consult other indicators or analysis so that you are not relying on only one indicator to determine market entry or exit.
The ATR’s value is a measurement of the market volatility. When a market is increasing in volatility the ATR will have a higher value, and when the market is decreasing in volatility the ATR will have a lower value.
Calculation
The ATR is a moving average of the True Ranges defined below. The default period interval in Track ‘n Trade Live is 5 days. The ATR is calculated based on the largest of the three distances from the following:
Today’s HIGH to today’s LOW
Yesterday’s CLOSE to today’s HIGH
Yesterday’s CLOSE to today’s LOW
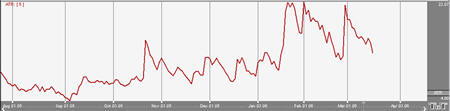
Example of the ATR in the Indicator Window
Preferences
Open the Preferences Tab in your Control Panel. Select the ATR quick link at the right of the indicator window. (Once you click on the chart, the Preference tab will go back to chart settings.)
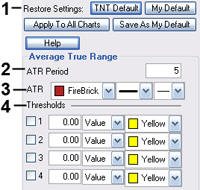 1. Restore Settings: TNT Default will change your settings back to the original software settings. My Default will change current settings to your personalized default settings. Apply To All Charts will apply your selected settings on all open charts. Save As My Default will save your current personal settings.
2. Period: Specify the number of days to be used in calculating the ATR.
3. Line: Choose the color, line style, and line thickness of your line.
4. Thresholds: Gives you the option of displaying four threshold lines, which can be displayed as a value or a percentage in the Indicator Window. You also have the option to change the color of the threshold line.