You are here
PPO - % Price Oscillator
The PPO indicator shows the relationship between two moving averages. The PPO indicator is a modification of the highly regarded and effective MACD indicator. This enhancement provides us the ability to receive the differences between the two moving averages as a percentage. This allows the trader to easily compare stocks with different prices. For example, a PPO result of 20 means that the short-term average is 20% above the long-term average.
Calculation
To calculate the PPO, subtract the 26-day exponential moving average (EMA) from the nine-day EMA and divide this difference by the 26-day EMA. The end result is a percentage that tells the trader where the short-term average is relative to the longer-term average.
PPO = (Fast_EMA - Slow_EMA) / Fast_EMA
Additionally, the PPO histogram can be calculated by using the MA of a PPO itself:
PPO_Histogram = PPO - EMA_PPO
Buy/Sell Signals
A buy signal occurs when the PPO line crosses from below the trigger line to above the trigger line. A sell signal occurs when the PPO line crosses from above the trigger line to below the trigger line.
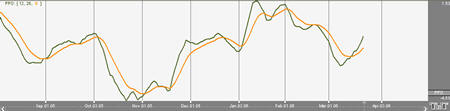
Example of Percent Price Oscillator
Preferences
Open the Preferences Tab in your Control Panel. Select the PPO quick link at the right of the indicator window. (Once you click on the chart, the Preference tab will go back to chart settings.)
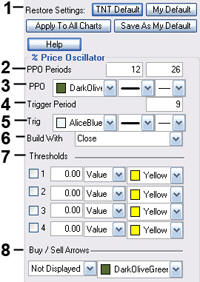 1. Restore Settings: TNT Default will change your settings back to the original software settings. My Default will change current settings to your personalized default settings. Apply To All Charts will apply your selected settings on all open charts. Save As My Default will save your current personal settings.
2. PPO Periods: Specify the number of days to be used in calculating the PPO.
3. PPO: Choose the color, line style, and line thickness of your PPO line.
4. Trigger: Specify the number of days used in calculating the Trigger.
5. Line: Choose the color, line style, and line thickness of your Trigger line.
6. Build With: Choose either Close, Open, High, or Low to build with.
7. Thresholds: Gives you the option of displaying four threshold lines, which can be displayed as a value or a percentage in the Indicator Window. You also have the option to change the color of the threshold line.
8. Buy/Sell Arrows: Turns the display for buy/sell arrows on and off. You also have the option to change the color of the buy/sell arrows.