You are here
SSTO - Slow Stochastics
Slow Stochastics are interpreted the same as Fast Stochastics. Quite often the faster of the two indicators moves in and out of the overbought/oversold regions quickly.
Calculation
The calculations for the slow stochastic are similar to the normal stochastic. The first step in computing the stochastic indicator is to determine the n period high and low. Suppose you specified twenty periods for the stochastic. Determine the highest high and lowest low during the last twenty trading intervals. It determines the trading range for that time period. The trading range changes on a continuous basis.
The calculations for the %K is here:
%Kt = ( (CloseT - LowN) / (HighN - LowN) ) x 100
%Kt: The value for the first %K for the current time period.
CloseT: The closing price for the current Time period.
LowN: The lowest low during the N periods.
HighN: The highest high during the N time periods.
N: The value you specify.
Once you obtain the %K value, you start computing the %D value, which is an accumulative moving average. Since the %D is a moving average of a moving average, it requires several trading intervals before the values are calculated properly. If you specify a 20 period stochastic, the software system requires 26 trading intervals before it can calculate valid %K and %D values. The formula for the %D is here:
%DT = ( (%DT-1 x 2) + %Kt) / 3
%DT: The value for %D in the current period.
%DT-1: The value for %D in the previous time period.
%Kt: The value for %K in the current period.
The values 2 and 3 are constants. You specify the constants and the length of the time period to examine for the trading range.
Once the %K and %D values for the normal stochastic are derived, the slow stochastic can be computed. The formula for the slow stochastic is here:
%KSLOW = %DNORMAL
%DSLOWt = ( ( %D SLOWt-1 x 2 ) + %K SLOWt-1 ) ) / 3
%KSLOW: The %D for the normal stochastic.
%DSLOWt: Slow %D value for the current period.
%DSLOWt-1: The slow %D for the previous period.
%KSLOWt-1: The slow %K for the previous period.
The values 2 and 3 are the smoothing constants. You may select different values.
Buy/Sell Signals
A buy signal occurs when the %K line crosses from below %D to above %D and both lines are less than the lower threshold. A sell signal occurs when the %K line crosses from above the %D line to below the %D line and both lines are greater than the upper threshold.
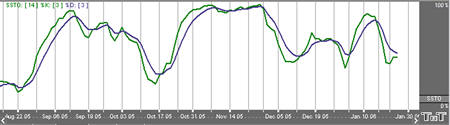
Example of Slow Stochastics
Preferences
Open the Preferences Tab in your Control Panel. Select the SSTO quick link at the right of the indicator window. (Once you click on the chart, the Preference tab will go back to chart settings.)
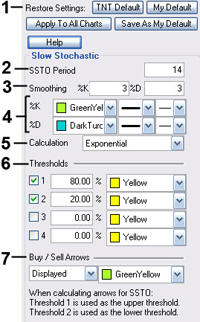 1. Restore Settings: TNT Default will change your settings back to the original software settings. My Default will change current settings to your personalized default settings. Update All SSTOs will apply your selected settings on all open charts. Save As My Default will save your current personal settings.
2. SSTO Period: To specify the number of days used in calculating the Slow Stochastics indicator, click in the box, highlight the number, and type in a new value.
3. Smoothing: To specify the number of days used in calculating smoothing, click in the box, highlight the number, then type in a new value.
4. %K/%D: Change the color, line style and line thickness of the %K and %D lines.
5. Calculation: Choose from Exponential, Simple, and Wilder’s Smoothing for the type of formula used to calculate the indicator.
6. Thresholds: You are given the option to view four threshold lines in the Indicator Window. The crossing of the %D line above the %K line is a sell signal and only confirmed if this crossing occurred above the Upper Threshold line. The crossing of the %D line below the %K line is a buy signal and only confirmed if this crossing occurred below the Lower Threshold line. You can also change the color of the threshold lines.
7. Buy/Sell Arrows: You have the option to display buy/sell arrows on your chart according to the indicator. Click the arrow to view Displayed or Not Displayed. You also have the option to change the color of the buy/sell arrows.