You are here
AD - Williams Accum/Dist "Williams Accumulation/Distribution"
The main thing to look for is a difference between the AD and the market trend. If a market were to make a matching or lower low, or a matching or higher high and the AD fails to follow the market trend, this is divergence. Divergence implies that a reversal in the dominant trend may be near.
A series of lower lows would read as a decreasing AD. The pattern created by the AD and the differences in the chart are what the trader looks for. Divergence, or a difference from the pattern, is what you want to see. For example, if the market continues to march to higher territory and the AD follows by doing the same, then there is no divergence. However, if the market makes several new highs but the AD fails to make new highs, it is a warning signal of a market about to reverse direction.
Calculation
The AD index is computed several different ways. Some computations normalize the index, while others add extra smoothing factors through the use of moving averages.
The first comparison checks for accumulation. (Is the current close higher than the previous close?) If the market is accumulating, subtract the difference between current close and low. Add the difference to the Accumulation/Distribution Index. Traders perceive an undervalued market and they buy.
If Closet > Closet-1 then ADt = ADt-1 + (Closet - Lowt)
The second comparison checks for no change in price. If correct, the AD index does not change.
If Closet = Closet-1 then ADt = ADt-1
The last and final comparison checks for a down market. It looks for the current close below the previous close. If it’s correct, the market is distributing. The software first computes the difference between current high and close. Then it subtracts that difference from the AD index. This measures market distribution. Traders perceive an overvalued market and are selling.
If Closet < Closet-1 then ADt = ADt-1 - (Hight - Closet)
ADt: The accumulation/distribution index for the current period.
ADt-1: The accumulation/distribution index for the previous period.
Closet: The closing price for the current interval.
Closet-1: The closing price for the previous interval.
Hight: The true high price for the current interval (current high or previous close).
Lowt: The true low price for the current interval (current low or previous close).
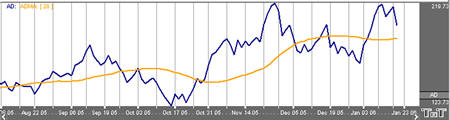
Example of the Williams AD in the Indicator Window
Preferences
Open the Preferences Tab in your Control Panel. Select the AD quick link at the right of the indicator window. (Once you click on the chart, the Preference tab will go back to chart settings.)
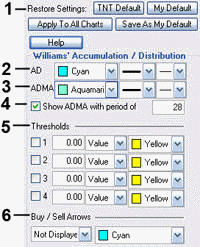 1. Restore Settings: TNT Default will change your settings back to the original software settings. My Default will change current settings to your personalized default settings. Apply To All Charts will apply your selected settings on all open charts. Save As My Default will save your current personal settings.
2. AD: Change the color, line style, and line thickness of the Accumulation and Distribution line in the Indicator Window.
3. ADMA: Change the color, line style, and line thickness of the Accumulation/Distribution Moving Average line in the Indicator Window.
4. Show ADMA: Uncheck this box to hide the ADMA line. When the box is checked, specify the number of days used in calculating the ADMA Indicator. The default number is 28 days.
5. Thresholds: Gives you the option of displaying four threshold lines, which can be displayed as a value or a percentage in the Indicator Window. You also have the option to change the color of the threshold line.
6. Buy/Sell Arrows: You have the option to display buy/sell arrows on your chart according to the indicator. Click the arrow to view Displayed or Not Displayed. You also have the option to change the color of the buy/sell arrows.