You are here
ULT - Ultimate Oscillator
This indicator, as with the RSI indicator, works on an overbought and oversold region. Mr. Williams states that the upper threshold should start at 70% and the lower threshold at 30%, but depending on the market, the volatility, and the settings, you may need to adjust the thresholds to either higher or lower settings to obtain signals.
Once the ULT line crosses above the upper threshold into the overbought region, it is time to anticipate a reversal in price and lower prices to ensue. When the ULT line crosses below the lower threshold, it is time to anticipate a reversal in price and anticipate prices to rise once again. Many traders like to use a 50% line to reconfirm price action. Crossing the 50% line is a confirmation of the overall trend.
Calculation
The True Low (TL) is the lower of today’s low or yesterday’s close. Calculate today’s Buying Pressure (BP) like this:
BP = Today’s close - Today’s TL
Calculate today’s True Range (TR) by finding the largest outcome of one of the following equations:
TR = Today’s High - Today’s Low
Today’s High - Yesterday’s Close
Today’s Close - Today’s Low
Calculate BPSum1, BPSum2, and BPSum3 by adding up all of the BPs for each of the three specified time frames. Calculate TRSum1, TRSum2, and TRSum3 the same way with the TR’s.
The Raw Ultimate Oscillator (RawUO) is calculated here:
RawUO = 4 x (BPSum1 / TRSum1) + 2 x (BPSum2 / TRSum2) + (BPSum3 / TRSum3)
The Final Ultimate Oscillator is calculated here:
FUO = [ RawUO / (4 + 2 + 1) ] x 100
Buy/Sell Signals
A buy signal occurs when the ULT line crosses from below the lower threshold to above the lower threshold. A sell signal occurs when the ULT line crosses from above the upper threshold to below the upper threshold.
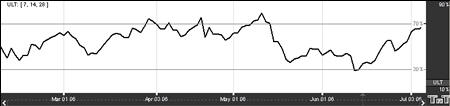
Example of Ultimate Oscillator
Preferences
Open the Preferences Tab in your Control Panel. Select the ULT quick link at the right of the indicator window. (Once you click on the chart, the Preference tab will go back to chart settings.)
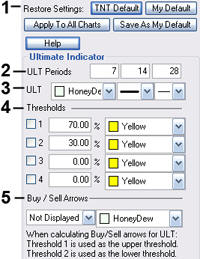 1. Restore Settings: TNT Default will change your settings back to the original software settings. My Default will change current settings to your personalized default settings. Update All ULTs will apply your selected settings on all open charts. Save As My Default will save your current personal settings.
2. ULT Periods: Specify the number of days to be used in calculating the SRSI.
3. Line: Choose the color, line style, and line thickness of your line.
4. Thresholds: Gives you the option of displaying four threshold lines, which can be displayed as a value or a percentage in the Indicator Window. You also have the option to change the color of the threshold line.
5. Buy/Sell Arrows: Turns the display for buy/sell arrows on and off. You also have the option to change the color of the buy/sell arrows.