You are here
%R - Williams' %R "Williams Percent R"
Williams’s basic rule is simple: when the %R is lower than 20% and becomes greater than 20%, it is interpreted as a buy signal. Conversely, when the %R is higher than 80% and becomes lower than 80%, a sell signal is activated.
Changing the sensitivity of the indicator to work for you is essential to making the study a better tool. The longer the period for the %R, the less sensitive it will be. The indicator will move less but will be more smooth. A number of technical traders use a value that is less volatile, or in other words, a larger value. Many traders find it better to use a strategy where the market leaves the areas of overbought/ oversold before entering a trade position. In either case, using solid exit strategies is important with this indicator.
Calculation
You must first determine the highest high and lowest low for the length of the interval. This is the trading range for the specified interval:
%Rt = ( (Highn - Closet) / (Highn - Lown) ) x -100
%Rt: The percent of the range for the current period.
Highn: The highest price during the past n trading periods.
Closet: The closing price for the current period.
Lown: The lowest price during the past n trading periods.
n: The length of the interval.
Example: Assume the market is Treasury Bills. The high for the past ten trading intervals is 9275, and the low is 9125. The closing price in the current period is 9267.
This is what you get if you substitute those values in the equation:
%R = ( (9275 - 9267) / (9275 - 9125) ) x 100 br /> = (8 / 150) x 100
= 5.33
%Rt = ( (Closet - Lown) / (Highn - Lown) ) x -100
Buy/Sell Signal
A buy signal occurs when the %R line crosses from below the lower threshold to above the lower threshold. A sell signal occurs when the %R line crosses from below the upper threshold to below the upper threshold.
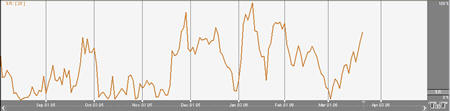
Example of Williams %R
Preferences
Open the Preferences Tab in your Control Panel. Select the %R quick link at the right of the indicator window. (Once you click on the chart, the Preference tab will go back to chart settings.)
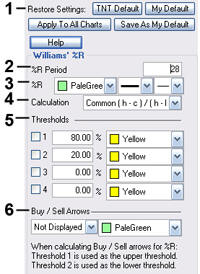 1. Restore Settings: TNT Default will change your settings back to the original software settings. My Default will change current settings to your personalized default settings. Update All %Rs will apply your selected settings on all open charts. Save As My Default will save your current personal settings.
2. %R Period: To specify the number of days used in calculating %R simply click in the box, highlight the current number, and type in a new value.
3. %R: Change the color, style, and thickness of the line.
4. Calculation: Choose between common or updated calculations.
5. Thresholds: Gives you the option of displaying four threshold lines, which can be displayed as a value or a percentage in the Indicator Window. You also have the option to change the color of the threshold line.
6. Buy/Sell Arrows: Turns the display for buy/sell arrows on and off. You also have the option to change the color of the buy/sell arrows.