- Getting Started
- Control Panel
- Toolbars
- Basic Tools
- Standard Tools
- Crosshair Tool
- Line Tool
- Multi-Line Tool
- Arc Tool
- Bar Calculator Tool
- 123 / ABC Tool
- Head & Shoulders Tool
- Dart Tool
- Wedge Tool
- Trend Fan Tool
- Trend Channel Tool
- Raff Regression Channel Tool
- Horizontal Channel Tool
- N% Ruler Tool
- Arrow Tool
- Text Tool
- Box Tool
- Circle Tool
- Dollar Calculator
- Risk vs. Reward Calculator
- Place Order Tool
- Advanced Technical Tools
- Customize the Toolbars
- Chart Overlay Indicators
- Indicator Windows
- Plug-Ins
- End User License Agreement(EULA)
- Gecko Software Risk Disclosure
You are here
%B - Percent Bollinger Bands
Bollinger Bands are calculated as a simple moving average shifted up and down by a number of standard deviations. Percent Bollinger Bands relate the underlying price of an instrument to the range of these Bollinger Bands. This gives the user an adaptive measure of volatility which can be used in the same way as other momentum indicators. Buy when the indicator bottoms below 0.00 and turns up, and sell when the indicator peaks above 100.00 and turns down.
You can also use the indicator by looking for the divergence between the indicator and the charts. Sharp price advances and declines usually accompany market tops and bottoms, and as a market climbs or falls toward a bottom, the indicator will tend to initially follow the price trend and then fall off, leading to bullish or bearish divergences with the chart.
Buy Sell Signals
A buy signal occurs when %B value crosses from below the 0 line to above the 0 line. A sell signal occurs when %B value crosses from above the 0 line to below the 0 line.
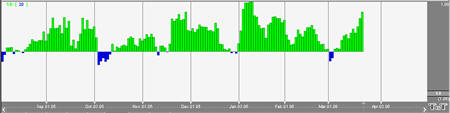
Example of Percent Bollinger Bands
Preferences
Open the Preferences Tab in your Control Panel. Select the %B quick link at the right of the indicator window. (Once you click on the chart, the Preference tab will go back to chart settings.)
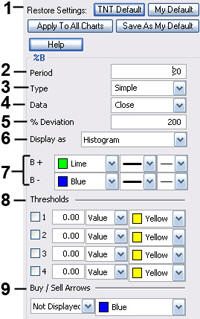 1. Restore Settings: TNT Default will change your settings back to the original software settings. My Default will change current settings to your personalized default settings. Apply To All Charts will apply your selected settings on all open charts. Save As My Default will save your current personal settings.
2. Period: Specify the number of days to be used in calculating the %B.
3. % Deviation: Define the displacement between the bands.
4. Type: Choose from Simple, Linear Weight, or Exponential.
5. Data: Choose from Open, High, Low, or Close.
6. Display as: Choose to view as a Histogram or Line.
7. B+/B-: Choose the color, line style, and line thickness of your line.
8. Thresholds: Gives you the option of displaying four threshold lines, which can be displayed as a value or a percentage in the Indicator Window. You also have the option to change the color of the threshold line.
9. Buy/Sell Arrows: Turns the display for buy/sell arrows on and off. You also have the option to change the color of the buy/sell arrows.