You are here
ROC - Rate of Change
The ROC indicator is used to help a trader determine the rate at which a market is either increasing or decreasing in strength or weakness. A rising rate of change indicates an advancing market, while a decreasing rate of change indicates a declining market. As the rate of change line approaches the centerline, the rate of change is considered to be in equilibrium. This is somewhat of a misnomer since the ROC is on a relative scale and scales against historical rates. What is equilibrium today will not be the equilibrium line down the road, and what is not equilibrium today will appear to be so from a historical point of view.
Comparing the ROC’s of different time-spans improves the accuracy of the analysis. A 12 month period is usually the most reliable for long-term trends, and a 3 or 6 month period works well for intermediate trends. A 10 or 12-day ROC is a good short-term indicator, oscillating in a fairly regular cycle.
The lower the ROC, the more undersold the market and the more likely a recovery. Although the opposite may hold true in that the higher the ROC, the more overbought the market, both extremes can indicate the formation of a sideways channel.
Calculations
The calculation for the ROC is here:
ROC = 100 x (Today’s close - Close 10 periods ago) / (Close 10 periods ago)
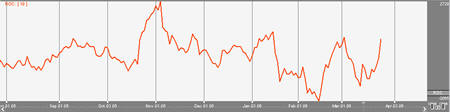
Example of Rate of Change
Preferences
Open the Preferences Tab in your Control Panel. Select the ROC quick link at the right of the indicator window. (Once you click on the chart, the Preference tab will go back to chart settings.)
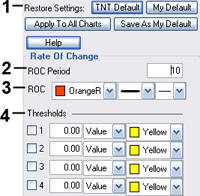 1. Restore Settings: TNT Default will change your settings back to the original software settings. My Default will change current settings to your personalized default settings. Update All ROCs will apply your selected settings on all open charts. Save As My Default will save your current personal settings.
2. Period: Specify the number of days to be used in calculating the ROC.
3. Line: Choose the color, line style, and line thickness of your line.
4. Thresholds: Gives you the option of displaying four threshold lines, which can be displayed as a value or a percentage in the Indicator Window. You also have the option to change the color of the threshold line.