- Getting Started
- Control Panel
- Toolbars
- Basic Tools
- Standard Tools
- Crosshair Tool
- Line Tool
- Multi-Line Tool
- Arc Tool
- Bar Calculator Tool
- 123 / ABC Tool
- Head & Shoulders Tool
- Dart Tool
- Wedge Tool
- Trend Fan Tool
- Trend Channel Tool
- Raff Regression Channel Tool
- Horizontal Channel Tool
- N% Ruler Tool
- Arrow Tool
- Text Tool
- Box Tool
- Circle Tool
- Dollar Calculator
- Risk vs. Reward Calculator
- Place Order Tool
- Advanced Technical Tools
- Customize the Toolbars
- Chart Overlay Indicators
- Indicator Windows
- Plug-Ins
- End User License Agreement(EULA)
- Gecko Software Risk Disclosure
You are here
BW - Bollinger Bandwidth
Bollinger Bands measure volatility by placing bands on either side of a moving average. These bands are charted two standard deviations away from the average. As the average changes, the values of the two standard deviations also change. The Bollinger Bandwidth, developed by John Bollinger, represents the expanding and contracting of the bands based on recent volatility.
During a period of rising price volatility, the distance between the two bands will widen (BB Width will increase). Conversely, during a period of low market volatility, the distance between the two bands will contract (BW will decrease).
The tendency is for the bands to alternate between expansion and contraction. When the bands are unusually far apart, it is often a sign that the current trend may be ending. When the distance between the two bands has narrowed, it is often a sign that a market may be about to begin a new trend.
The BW gives an indication of how wide the Bollinger Bands are as a function of the middle band. It is used to identify the squeeze at low values and the end of trends at high values.
Calculation
The calculation of the BW is here:
Bollinger Bandwidth = [Top Bollinger Band (x periods)] - [Bottom Bollinger Band (x periods)] / Simple Moving Average Close (x periods)
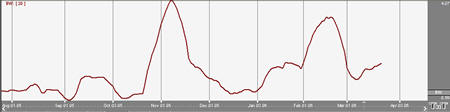
Example of the BW in the Indicator Window
Preferences
Open the Preferences Tab in your Control Panel. Select the BW quick link at the right of the indicator window. (Once you click on the chart, the Preference tab will go back to chart settings.)
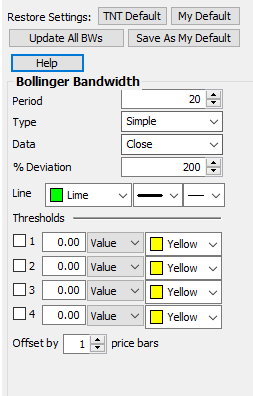 Restore Settings: TNT Default will change your settings back to the original software settings. My Default will change current settings to your personalized default settings. Apply To All Charts will apply your selected settings on all open charts. Save As My Default will save your current personal settings.
Period: Specify the number of days to be used in calculating the BW.
% Deviation: Define the displacement between the bands.
Type: Choose from Simple, Linear Weight, or Exponential.
Data: Choose from either Open, High, Low, or Close.
Line: Choose the color, line style, and line thickness of your line.
Thresholds: Gives you the option of displaying four threshold lines, which can be displayed as a value or a percentage in the Indicator Window. You also have the option to change the color of the threshold line.
Offset by X price bars: May be used to shift the BW indicator forward or backward within the chart window, using the number of price bars selected.