You are here
SRSI - Stochastic Relative Strength Index
The Stochastics RSI is a combination of these two indicators, where the %K within the Stochastics formula is replaced by the RSI. The formula is then set on a 0 to 100 scale for both the Stochastics indicator as well as the RSI is read in much the same manner as the traditional RSI. When the SRSI reaches up into the upper region above the upper threshold line, the market is considered overbought and anticipate a reversal of the trend. When the SRSI reaches down into the lower region below the lower threshold, the market is considered oversold and a reversal is anticipated. Traditionally, the upper threshold marker is set at 70% and the lower marker is set at 30%.
Calculation
The calculation for the SRSI is here:
StochRSI = (RSI - LowRSIn) / (HighRSIn - LowRSIn)
RSI: The current level of the RSI indicator.
LowRSIn: The lowest level the RSI reached over the last n periods.
HighRSIn: The highest level the RSI reached over the last n periods.
Buy/Sell Signals
A buy signal occurs when the SRSI line crosses from below the lower threshold to above the lower threshold into the channel. A sell signal occurs when the SRSI line crosses from above the upper threshold to below the upper threshold into the channel.
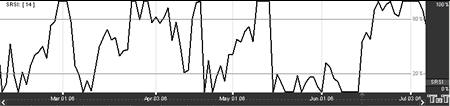
Example of Stochastic Relative Strength Index
Preferences
Open the Preferences Tab in your Control Panel. Select the SRSI quick link at the right of the indicator window. (Once you click on the chart, the Preference tab will go back to chart settings.)
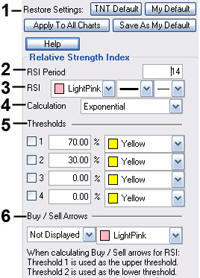 1. Restore Settings: TNT Default will change your settings back to the original software settings. My Default will change current settings to your personalized default settings. Update All SRSIs will apply your selected settings on all open charts. Save As My Default will save your current personal settings.
2. SRSI Period: Specify the number of days to be used in calculating the SRSI.
3. Underlying RSI Period: Specify the number of days used in calculating the Underlying RSI.
4. Calculation: Choose from Exponential, Simple, or Wilder’s Smoothing.
5. Line: Choose the color, line style, and line thickness of your line.
6. Thresholds: Gives you the option of displaying four threshold lines, which can be displayed as a value or a percentage in the Indicator Window. You also have the option to change the color of the threshold line.
7. Buy/Sell Arrows: Turns the display for buy/sell arrows on and off. You also have the option to change the color of the buy/sell arrows.