- Getting Started
- Control Panel
- Toolbars
- Chart Overlay Indicators
- Indicator Windows
- COT - Commitment of Traders
- PROB - Market Probability
- RBN - Ribbon
- SEAS - Seasonal Trend
- AD - Williams Accum/Dist "Williams Accumulation/Distribution"
- ATR - Average True Range
- %B - Percent Bollinger Bands
- BW - Bollinger Bandwidth
- CCI - Commodity Channel Index
- CMF - Chaikin Money Flow
- DMI - Directional Movement Index
- FSTO - Fast Stochastics
- GTR - Gator Oscillator
- HVOL - Historic Volatility
- KST - Know Sure Thing
- MACD - Moving Average Convergence/Divergence
- MFI - Money Flow Index
- MOM - Momentum
- OBV - On Balance Volume
- PPO - % Price Oscillator
- PVO - % Volume Oscillator
- %R - Williams' %R "Williams Percent R"
- ROC - Rate of Change
- RSI - Relative Strength Index
- SRSI - Stochastic Relative Strength Index
- SSTO - Slow Stochastics
- TRIX - Triple Exponential Average
- ULT - Ultimate Oscillator
- VOL - Volume
- Plug-Ins
- End User License Agreement(EULA)
- Gecko Software Risk Disclosure
You are here
CCI - Commodity Channel Index
The Commodity Channel Index (CCI) is designed to detect the beginning and ending of market trends. The formula standardizes market prices to help spot market trend deviations.
Donald Lambert, the creator of this indicator, says that 70% to 80% of all price fluctuations fall within +100 and -100 as measured by the index. The calculation for CCI measures the average daily price’s distance from a moving average of average daily prices.
There are basic trading rules for the CCI: buy when the CCI exceeds -100 and sell when the CCI drops below +100. In other words, a buy signal is generated when the indicator enters the channel, or exceeds -100, coming up from the bottom. A sell signal is generated when the indicator enters the channel from the top or drops below +100.
Followers of the CCI generally look to establish long positions when the CCI exceeds the -100 level, indicating that prices are in a strong uptrend. Most users of this indicator also try to look for patterns within the indicator, such as higher highs, and look for CCI movements to be confirmed by general price readings as well.
The purpose of the CCI index is to keep you out of the market during consolidation, or weak trending periods. By measuring the difference between average prices and mean average prices, this indicator attempts to isolate only strongly trending markets, similar to momentum and MACD.
When CCI is viewed in the Indicator window of Track ‘n Trade Live, -100 is 33% of the window and +100 is 66% of the window. Guides could be set at these two points for ease in tracking CCI. You could also say that -85 would be roughly 36% and +85 would be roughly 64% of the window.
Calculation
The proper calculation of the CCI requires several steps in the proper sequence. You must first compute the typical price using the high, low, and close for the interval. Simply, take the average of the three values.
TP = (Hight + Lowt + Closet) / 3
TPt: Represents the typical price.
Hight: The highest price for this interval.
Lowt: The lowest price for this interval.
Closet: The closing price for this interval.
Next, calculate a simple moving average of the typical price for the number of periods specified.
TPAVGt = (TP1 + TP2 +... + TPn) / n
TPAVGt: The moving average of the typical price.
TPn: The typical price for the nth interval.
N: Number of intervals for the average.
Compute the mean deviation.
MDt = (|TPAVG1 - TP1| + ... + |TPAVG1 - TPn |) / n
MDT: The mean deviation for this interval.
TPn: The typical price for the nth interval.
N: Number of intervals.
Note: The symbol | | designates absolute value. Negative differences, as well as positive differences, are treated as positive values.
Final Computation:
CCIt = (TPt - TPAVGt) / (.015 x MDT)
CCIt: The Commodity Channel Index for the current period.
TPt: The typical price for the current period.
TPAVGt: The moving average of the typical price.
.015: A constant.
MDT: The mean deviation for this period.
Buy/Sell Signals
For a line drawing, a buy signal occurs when the CCI line crosses from below the lower threshold to above the lower threshold. A sell signal occurs when the CCI line crosses from above the upper threshold to below the upper threshold.
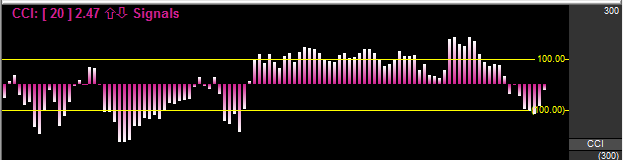
For a histogram drawing, a buy signal occurs when the CCI value crosses from below the 0 line to above the 0 line. A sell signal occurs when the CCI value crosses from above the 0 line to below the 0 line.
Example of Commodity Channel Index
Preferences
Open the Preferences Tab in your Control Panel. Select the CCI quick link at the right of the indicator window. (Once you click on the chart, the Preference tab will go back to chart settings.)
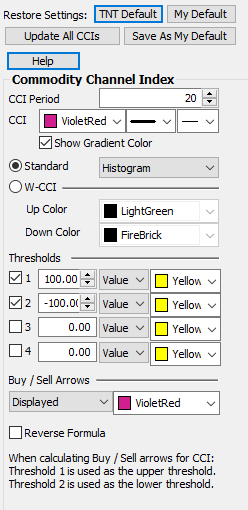 Restore Settings: TNT Default will change your settings back to the original software settings. My Default will change current settings to your personalized default settings. Apply To All Charts will apply your selected settings on all open charts. Save As My Default will save your current personal settings.
CCI Period: To specify the number of days used in calculating CCI, simply click in the box, highlight the current number, and type in a new value.
CCI: Change the color, line style, and line thickness of the CCI.
Show Gradient Color: Toggle gradient color shading on or off.
Display as: The CCI can be displayed as a line or a histogram.
WCCI Option: When you select the WCCI (Woodies CCI) option in the CCI preferences tab this will apply a histogram divided in the middle. See the WCCI example below.
WCCI Colors: These two color options allow you to select the color of the histogram above and below (up or down colors) the zero line.
Thresholds: The Upper Threshold and Lower Threshold are automatically displayed in the Indicator Window. The crossing of the CCI line below the Upper threshold is a sell signal. The crossing of the CCI above the Lower threshold is a buy signal. You also have the option to view the threshold as a percent or a value, and change the color of the threshold lines.
Buy/Sell Arrows: You have the option to display buy/sell arrows on your chart according to the indicator. Click the arrow to view Displayed or Not Displayed. You also have the option to change the color of the buy/sell arrows.