- Getting Started
- Control Panel
- Toolbars
- Chart Overlay Indicators
- Indicator Windows
- COT - Commitment of Traders
- PROB - Market Probability
- RBN - Ribbon
- SEAS - Seasonal Trend
- AD - Williams Accum/Dist "Williams Accumulation/Distribution"
- ATR - Average True Range
- %B - Percent Bollinger Bands
- BW - Bollinger Bandwidth
- CCI - Commodity Channel Index
- CMF - Chaikin Money Flow
- DMI - Directional Movement Index
- FSTO - Fast Stochastics
- GTR - Gator Oscillator
- HVOL - Historic Volatility
- KST - Know Sure Thing
- MACD - Moving Average Convergence/Divergence
- MFI - Money Flow Index
- MOM - Momentum
- OBV - On Balance Volume
- PPO - % Price Oscillator
- PVO - % Volume Oscillator
- %R - Williams' %R "Williams Percent R"
- ROC - Rate of Change
- RSI - Relative Strength Index
- SRSI - Stochastic Relative Strength Index
- SSTO - Slow Stochastics
- TRIX - Triple Exponential Average
- ULT - Ultimate Oscillator
- VOL - Volume
- Plug-Ins
- End User License Agreement(EULA)
- Gecko Software Risk Disclosure
You are here
MFI - Money Flow Index
The MFI is a momentum based indicator, similar to the RSI, %R, and CCI. The MFI incorporates a more rigid calculation, giving the telltale signs of a more rigid line and a better indication of money flowing in or out of any given security.
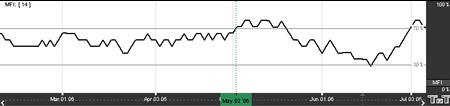
The theory says that as money flows into the equity, or volume increases, the MFI will increase its rate of climb. As money flows out of the equity, volume decreases, and the MFI will decrease its rate of climb. The MFI is a classic overbought/oversold indicator based on a 0-100 scale. When the MFI reaches up above the top threshold, which is traditionally set at 75-80%, the equity is considered overbought and a retracement is anticipated. When the MFI line falls below the 20-25% threshold, the underlying equity is considered oversold and a reversal is anticipated once again.
Calculation
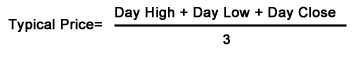
The "flow" of money is the product of price and volume and shows the demand for a security and a certain price. The money flow is not the same as the Money Flow Index but rather is a component of calculating it. So when calculating the money flow, we first need to find the average price for a period. Since we are often looking at a 14-day period, we will calculate the typical price for a day and use that to create a 14-day average.
The calculation of MFI is here:
Money Flow = (Typical Price) x (Volume)
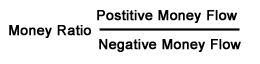
The MFI compares the ratio of "positive" money flow and "negative" money flow. If typical price today is greater than yesterday, it is considered positive money. For a 14-day average, the sum of all positive money for those 14 days is the positive money flow. The MFI is based on the ratio of positive/negative money flow (Money Ratio).
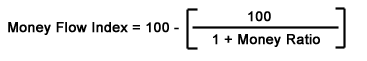
Finally, the MFI can be calculated using this ratio:
Buy/Sell Signals
A buy signal occurs when the MFI line crosses from below the lower threshold to above the lower threshold. A sell signal occurs when the MFI line crosses from above the upper threshold to below the upper threshold.
Example of Money Flow Index
Preferences
Open the Preferences Tab in your Control Panel. Select the MFI quick link at the right of the indicator window. (Once you click on the chart, the Preference tab will go back to chart settings.)
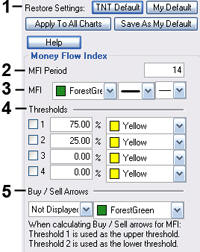 1. Restore Settings: TNT Default will change your settings back to the original software settings. My Default will change current settings to your personalized default settings. Update All MFI's will apply your selected settings on all open charts. Save As My Default will save your current personal settings.
2. MFI Period: To specify the number of days used in calculating the MFI, click in the box, highlight the current number, and type in a new value.
3. MFI: Change the color, style, and thickness of the line.
4. Thresholds: Gives you the option of displaying four threshold lines, which can be displayed as a value or a percentage in the Indicator Window. You also have the option to change the color of the threshold line.
5. Buy/Sell Arrows: Turns the display for buy/sell arrows on and off. You also have the option to change the color of the buy/sell arrows.