You are here
Chart Overlay Indicators
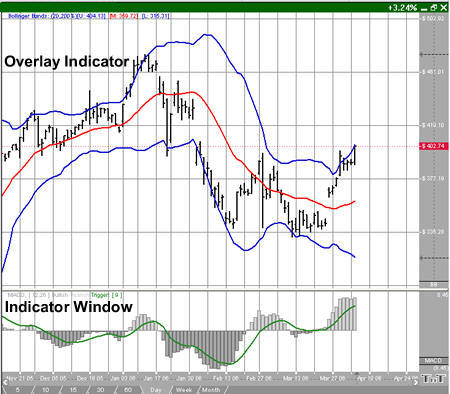
Overlays are shown directly on the chart.
To display an Overlay Indicator, right-click the Chart Window and select Chart Overlays. Select the name of the Overlay Indicator that you would like to view from the drop-down menu. A checkmark will appear next to any indicators you have selected and all selected indicators will show directly on your chart, not in the indicator window. To remove an overlay indicator from your chart, click on the indicator in the drop-down menu again and the checkmark with disappear.
The Overlays that come from plug-ins are listed at the top of the menu, these are further discussed in the Plug-Ins section of this manual.
Overlay Preferences (Quick Links)
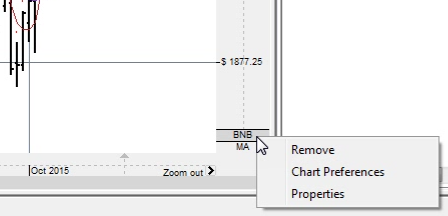
In the bottom right of the chart, you will see symbols that will correlate with which Overlays you have selected. If you click these symbols the control panel will switch to the preferences tab automatically with the preferences of that overlay displayed. These symbols abbreviations are included in the title of the Overlays in the manual with parenthesis.
You may right-click the abbreviated names to Remove the overlay, open Chart Preferences or view Properties for that overlay.
You can also navigate to the preferences of each overlay by right-clicking on the chart and go to Overlay Preferences and selecting the appropriate Overlay.
On Screen Text
When you open an overlay you will see text appear on your chart in the upper left-hand corner. You can choose whether to show this text, and choose where it appears by right-clicking on your chart. Mouse over On Screen Text to view your options. This also changes how indicator on-screen text is displayed.
The Overlays are explained in detail in the following sections: