- Getting Started
- Control Panel
- Toolbars
- Chart Overlay Indicators
- Indicator Windows
- Plug-Ins
- End User License Agreement(EULA)
- Gecko Software Risk Disclosure
You are here
MACD - Moving Average Convergence/Divergence
MACD was created in an attempt to determine the strength of a trend along with the direction of that trend. Gerald Appel created a system that looked at two exponential moving averages and the difference between those two averages. Looking at these moving averages of the market we are able to see clear buy and sell signals. We are also able to get a more accurate signal by averaging the difference in the two moving averages.
Computing this indicator requires the use of exponential moving averages. Exponential moving averages are different than simple moving averages; instead of looking at only the last few days and averaging them, the exponential averages look at all the prices and puts more weight on the most recent data. This type of weighted average gives a smoother average price that reacts quickly to market moves. The two averages of MACD move above and below a baseline, which gives an indication of the strength of the current move. This placement of the two averages in relation to the baseline is calculated by looking at the exponential moving average of the difference between the two averages. Even though the two averages may cross, the divergence, or true indication of the signal, is not shown until both averages cross the baseline.
Keeping this in mind, an ideal buy signal is seen on a move where the shorter-term average moves above the other average and both averages cross above the baseline of zero. A sell signal would be the opposite of this.
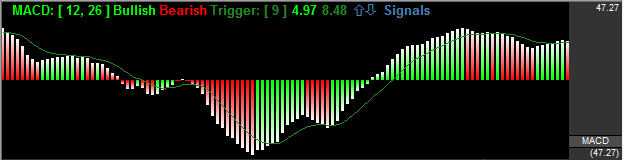
The histogram method of MACD is read as a straight line above or below the zero baseline. This line represents the difference between the Moving Averages. When the moving averages move above the baseline they are indicating a buy, and as the difference between the averages increases the lines will get taller.
The opposite is true of a sell signal. Track ‘n Trade Live's ability to display MACD in this fashion is vital because it allows you to read the strength of the current trend along with the signal to buy or sell.
When MACD is plotted as a histogram, the values used to plot the histogram are the differences between the two moving averages on each day. The “trigger” line that appears on this chart is an average of the histogram data, or a smoothed view of the histogram.
Using the MACD as a histogram will allow the trader to spot divergences between the indicator and the market price. A divergence is present when the market makes a higher high than the previous high, but the MACD histogram fails to make a corresponding higher high. This is considered to be a sign of weakness and a sell signal when the MACD breaks below the lowest point in between the divergent highs.
Bullish divergence is seen in an exact opposite fashion. Assume a market has been trending downward. The market has been consistently making lower lows, as has been the MACD histogram indicator. However, eventually, the MACD fails to make a lower low, corresponding to the lower low in price. If the MACD histogram line crosses above the highest high in between the divergent lows, then technical lore says higher prices should follow. You also have the choice to view the MACD indicator in a simple line style, instead of the histogram. In this view, there is no trigger line. The line style MACD gives buy and sell signals based off of the crossing of the two moving averages.
Calculation
In this study, the oscillator is the simple difference between the first two exponential moving averages:
OSCt = (EMA1 - EMA2)
OSCt: The oscillator for the current period.
EMA1: The first exponential moving average.
EMA2: The second exponential moving average.
The second part of the study computes an exponential moving average of the oscillator:
EMAosct = EMAosct-1+ (k x (OSCt - EMAosct-1))
EMAosct: The exponential moving average of the oscillator.
OSCt: The oscillator for the current interval.
EMAosct-1: The exponential moving average of the oscillator for the previous interval.
k: The exponential smoothing constant.
Since the second value, EMAosct, is an exponential moving average, it rises and falls slower than the oscillator, and the two lines generate crossover points. These crossover points are the buy/sell signals.
If the study is displayed as a histogram, each value for the lines is calculated:
DIFFt = OSCt - EMAosct
DIFFt: The difference between the oscillator for the current interval and the exponential moving average of the oscillator.
OSCt: The oscillator for the current interval.
EMAosct: The exponential moving average of the oscillator.
Buy/Sell Signals
For a line drawing, a buy signal occurs when the MACD crosses from below the trigger line to above the trigger line, and the trigger line is less than 0. A sell signal occurs when the MACD line crosses from above the trigger line to below the trigger line, and the trigger line is greater than 0. We recommend you turn on the 0 Value threshold line to make sure your trigger line is above/below 0 in meeting the buy/sell signal conditions. A histogram drawing with the trigger line works similarly.
For a histogram drawing, a buy signal occurs when the MACD value crosses from below the 0 line to above the 0 line. A sell signal occurs when the MACD value crosses from above the 0 line to below the 0 line.
Example of Moving Average Convergence/Divergence
Preferences
Open the Preferences Tab in your Control Panel. Select the MACD quick link at the right of the indicator window. (Once you click on the chart, the Preference tab will go back to chart settings.)
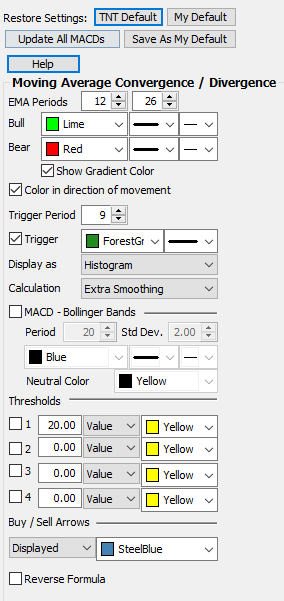 Restore Settings: TNT Default will change your settings back to the original software settings. My Default will change current settings to your personalized default settings. Apply To All Charts will apply your selected settings on all open charts. Save As My Default will save your current personal settings.
EMA Periods: The MACD is calculated using two exponential moving averages. To change the periods used in the formula, highlight the number and type in the new value desired.
Bull/Bear: Change the color, line style, and line thickness of the Bullish and Bearish lines.
Show Gradient Color: Toggle gradient color shading on or off.
Trigger Period: To change the number of days, click in the box, highlight the number, then type in the desired period.
Trigger: Check this box to hide the Trigger line. You can also change the color and line style of the Trigger.
Display as: The MACD indicator can be displayed differently. From the drop-down menu, choose either to view it as a line or as a histogram.
Calculation: Choose how you would like your chart calculated. You can choose Standard Calculation or Extra Smoothing. Extra Smoothing is a proprietary formula developed by Lan H. Turner, president, and CEO of Gecko Software, Inc. This method increases the movement in the MACD indicator and has shown to be more accurate (in Gecko Software’s market testing) than the standard calculation. Click the Extra Smoothing option to test its accuracy for yourself. Its relationship to the MACD is similar to the relationship between the Fast and Slow Stochastics - think of this indicator as the “Fast MACD.”
MACD - Bollinger Bands:
Period - To specify the number of days used in calculating the indicator, click in the box, highlight the number, and type in a new value.
Std Dev. - Defines the displacement between the Bollinger Bands. Click in the box, highlight the number and type a new value to change the displacement.
Change the color, line style, and line thickness of the MACD - Bollinger Bands.
Thresholds: Gives you the option of displaying four threshold lines, which can be displayed as a value or a percentage in the Indicator Window. You also have the option to change the color of the threshold line.
Buy/Sell Arrows: You have the option to display buy/sell arrows on your chart according to the indicator. Click the arrow to view Displayed or Not Displayed. You also have the option to change the color of the buy/sell arrows.