You are here
123 Tool
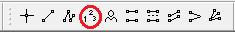
Use the 123 tool to chart both top and bottom formations. To draw a 123 formation, select the 123 tool from your Charting toolbar. Position the mouse pointer over the spot you would like to place the 1 point and click to place. Move to the 2 point and click to place. Move to the 3 point and click to place.
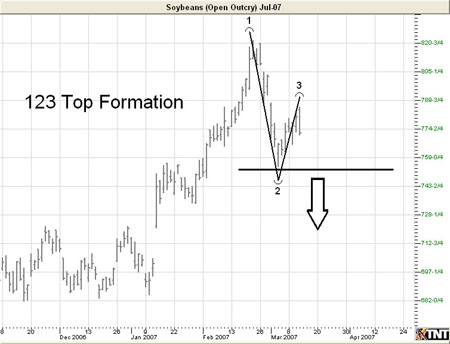
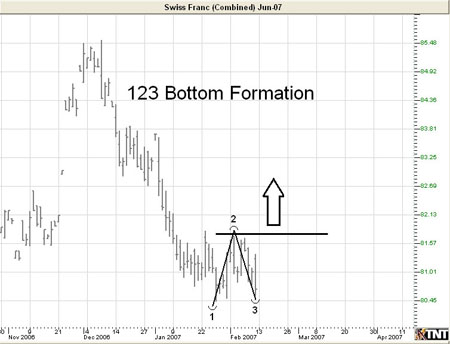
Example of the 123 Top and Bottom
Resizing the 123 Drawing
Select the 123 drawing by clicking on it. You will know the 123 drawing is selected when boxes appear on the corners. Click on a box and drag it to your desired length. Release the mouse button to place.
Moving the 123 Drawing
Select the 123 drawing by clicking on it. The drawing is selected when boxes appear at the 1, 2, and 3 end points. Drag to the new location and release the mouse button to place.
Deleting the 123 Drawing
Select the 123 drawing by clicking on it. Press the Del (Delete) key on your keyboard. You can also right-click the 123 drawing and select "Delete" from the drop-down menu.
Preferences
Select the 123 tool by clicking on it. The properties will show up in the preferences section of your control panel. Or you can right click on a drawn 123 tool and select Properties.
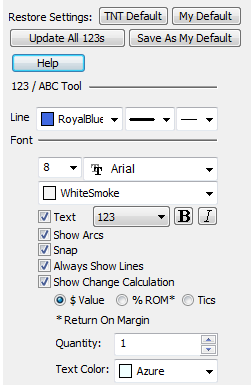
Restore Settings: TNT Default will change your settings back to the original software settings. My Default will change current settings to your personalized default settings. Apply To All Charts will apply your selected settings on all open charts. Save As My Default will save your current personal settings.
Line: From here you can choose the color, line style, and line thickness.
Font: Select the font, size, and color of the text. You can also choose to see numbers or letters. Select Text to hide or show your text on the chart.
Line Label (123): Select from different options how to label your 123 lines.
Text / Show Arcs / Snap / Always Show Lines: Select these options to display the 1-2-3 tool the way that you prefer. You can choose to hide or show Text, Arcs, Prediction, and line You can also choose whether you would like the 1-2-3 Tool to snap to price bars.
Show Change Calculation: Select to display the dollar value, percent return on margin or tics/pips value between price points 1-2 and 2-3.
Quantity: Determines the trading quantity used to calculate the $ Value, %ROM and Tics/Pips value for Change Calculation.
Text Color: Choose the color of your Change Calculation text.
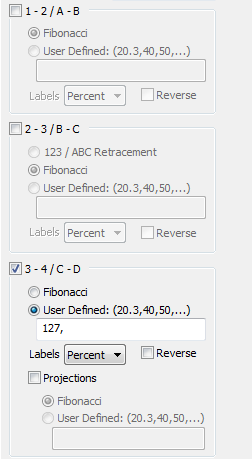 1 - 2 / A - B: Check to label distances between points 1-2.
Fibonacci: Will label Fibonacci percentage distances between points 1-2.
User Defined: Select to enter custom percentage distance markers.
Labels: Choose how you would like these values displayed within your chart. None will remove text descriptions, leaving only the line markers. Price will dispay the market price for each percentage value. Both will display both percent and market price. Reverse changes the labeling from ascending to descending.
2 - 3 / B - C: Activate to label percentage points on line 2-3.
123 / ABC Retracement: Activate to display the percent that line 2-3 retraced back through line 1-2.
3 - 4 / C - D: Creates the 123 projection line, with a 127% distance label by default. Check Fibonacci to display the default Fibonacci distance labels.
Projections: Activate to extend the 3-4 line beyond the default 127% distance.