You are here
Momentum (MOM)
The momentum indicator describes how price changes occur. It is a measure of the price change and shows if prices are increasing or decreasing at a continuous rate. Momentum can help gauge the current market trend. This indicator will sometimes shift ahead of a price change. It is both an indicator of trend as well as an indicator of a changing trend. The main thing to look for when using it is a divergence or difference between price behavior and the indicators behavior.
Momentum measures the rate of change in prices rather than actual price levels themselves. By measuring this rate of incline or decline, momentum tells whether the current trend is strengthening or weakening. If prices are rising and the momentum indicator is above the zero line, then the trend is gaining strength. If prices were rising but the indicator was sagging or went below the zero line, then we would interpret this as a sign of a coming change in trend. This is true because, although prices were still increasing, they are doing so at a decreasing rate.
The reverse would be true during a declining market. For example, think of a race car gaining 20 miles an hour each lap, until it starts to only gain 15 miles an hour, then 10 mph, then 5 mph until eventually it reaches its top speed. Like a race car, a market can not sustain growing momentum forever, and in many occurrences momentum slows before prices change direction.
Typically, the trade signals are to buy when the momentum indicator crosses from below the zero line to above it. This indicates that a new upward trend has begun, as the market is able to violate resistance levels and continue higher with increasing speed.
The sell signal would be to sell when the line crosses from above the zero line to below it. This indicates that the market is picking up speed to the downside and should be able to violate support areas. It is in this way that this unique indicator is a trend following tool.
Another way to use momentum is to establish regions of overbought or oversold. For example, in a declining market, the prices continue downward and the momentum indicator moves toward more negative but begins to level out. We would be looking for a buy signal when the indicator turned upward and out of that oversold region. It is in this way that momentum can sometimes shift ahead of the price movement. This use of the momentum indicator is a counter trend usage.
In either implementation of this indicator, the key is divergence. Seeing momentum make lower highs while prices are making higher highs, or momentum making higher lows while prices are making lower lows. Being aware of a difference in price movement and the momentum level can help the trader make informed trading decisions.
Calculation
The general formula to calculate momentum is here:
MOMt = Pi - Pi-n
MOMt: The momentum indicator for the current period.
Pi: The price of the i interval.
Pin: The price n intervals ago.
n: The number of intervals or length specified.
Example: Assume the current price is 7470. This example examines a momentum study using a length of ten trading intervals. The price ten intervals ago is 7400:
MOM = 7470 - 7400 = +70
The momentum value can have a very broad range. It is a function of the length you select for the momentum and the volatility of the underlying futures contract. Thus, it could swing very wide and wildly about the zero line.
Buy/Sell Signals
If we draw MOM with the MOMMA line, a sell signal occurs when the MOM
value crosses from above the MOMMA line to below the MOMMA line, and the
MOMMA line is greater than 0. A buy signal occurs when the MOM value
crosses from below the MOMMA line to above the MOMMA line, and the MOMMA line is less than 0. 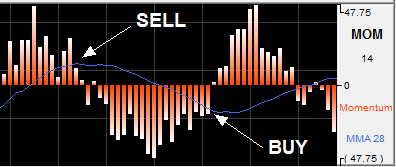
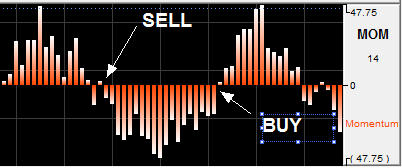
If we draw MOM without the MOMMA line, a buy signal occurs when the MOM value crosses from below the 0 line to above the 0 line. A sell signal occurs when the MOM value crosses from above the 0 line to below the 0 line.
Preferences
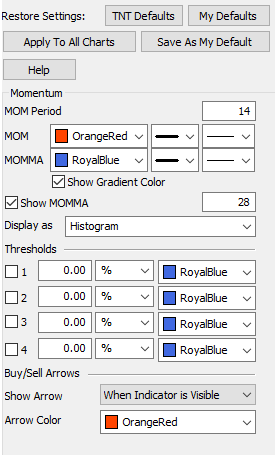
Right-click on the MOM button in your Indicator toolbar and select MOM Settings. The Preferences Tab will open in the Control Panel and the MOM preferences will be displayed. (Once you click on the chart, the Preference tab will go back to chart settings.)
 Restore Settings: TNT Default will change your settings back to the original software settings. My Default will change current settings to your personalized default settings. Apply To All Charts will apply your selected settings on all open charts. Save As My Default will save your current personal settings.
MOM Period: The number of bars, or period, to be used to calculate the study. You must determine a value suitable to your trading needs and methods. Some technicians argue that the length of the momentum indicator should equal the normal price cycle. The best method is to experiment with different lengths until you find the length that works best for that particular commodity you are trading.
MOM/MA: Choose the color, line style, and line thickness of your line.
Show Gradient Color: Toggle gradient color shading on or off.
Show MOMMA: Uncheck box if you would like to hide the Momentum Moving Average line. You can also specify the number of days used in calculating the MOMMA line.
Display as: The MOM indicator can be displayed differently. From the dropdown menu, choose either to view it as a line or as a histogram.
View up to four Thresholds at values and colors of your choice.
Choose when you want Buy/Sell Arrows to show and what color.