You are here
Moving Average Convergence/Divergence (MACD)
MACD was created in an attempt to determine the strength of a trend along with the direction of that trend. Gerald Appel created a system that looked at two exponential moving averages and the difference between those two averages. Looking at the difference of these moving averages of the market we are able to see clear buy and sell signals.
Computing this indicator requires the use of exponential moving averages (EMA) with the first one generally being a smaller period than the second. Exponential moving averages are different than simple moving averages; instead of looking at only the last few days and averaging them, the exponential averages look at all the prices and puts more weight on the most recent data. This type of weighted average gives a smoother average price that reacts quickly to market moves. The difference of the two averages is the MACD. It moves above and below a zero base line, the distance from which gives indication of the strength of the current move. A buy or sell condition is indicated as the MACD crosses from below to above or from above to below the zero line. When in MACD mode, the indicator key will be labeled MACD.
Often an additional exponential moving average of the MACD is used to act as a trigger line. A bullish crossover occurs when the MACD crosses to above it's trigger, and a bearish crossover occurs when it crosses to below the trigger. When the trigger is active the buy or sell arrows are keyed off of these cross over instead of the default baseline crossover. An additional trigger filter is available to only indicate sells when the MACD-trigger crossover is above the base line and only indicate buys when it is below the zero base line.
In addition to charting the MACD and it's trigger, you can chart just the difference of the MACD and it's trigger. When charting the difference the trigger period is used again to create a fourth exponential moving average on the trigger. This trigger of the trigger, if enabled, will adjust the location of the buy/sell signals using the same rules as explained above for the trigger on the MACD. When in Difference mode, the indicator key will be labeled MACDD.
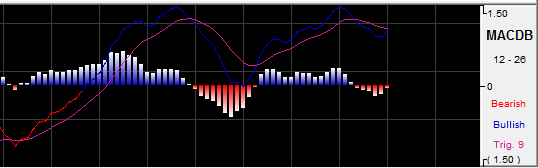
Finally you can chart both the MACD, with optional trigger, and the difference. This mode uses the same rules as the chart MACD mode for determining buy/sell arrows. The option to chart as a line or histogram will go away and the MACD and it's optional trigger will be plotted as a line. The MACD-trigger difference will be plotted as a histogram. When in Both mode, the indicator key will be labeled MACDB.
When MACD is plotted as a histogram, the values used to plot the histogram are the differences between the two moving averages on each day. The "trigger" line that appears on this chart is an average of the histogram data, or a smoothed view of the histogram.
Using the MACD as a histogram will allow the trader to spot divergences between the indicator and the market price. A divergence is present when the market makes a higher high than the previous high, but the MACD histogram fails to make a corresponding higher high. This is considered to be a sign of weakness and a sell signal when the MACD breaks below the lowest point in between the divergent highs.
Calculation
In this study, the oscillator is the simple difference between the first two exponential moving averages:
MACDt = (EMA1 - EMA2)
MACDt: The MACD value for the current interval.
EMA1: The first exponential moving average.
EMA2: The second exponential moving average.
The second part of the study computes an exponential moving average of the oscillator:
Triggt = Trigt-1+ (k x (MACDt - Trigt-1))
Trigt: The trigger value for the current interval.
MACDt: The MACD for the current interval.
Trigt-1: The trigger value for the previous interval.
k: The exponential smoothing constant.
Since the second value, Trigt, is an exponential moving average, it rises and falls slower than the MACD, and the two lines generate crossover points. These crossover points are the buy/sell signals when Trigger is enabled.
If the study is displayed as a histogram, each value for the lines is calculated:
DIFFt = MACDt - Trigt
DIFFt: The difference between the oscillator for the current interval and the exponential moving average of the oscillator.
MACDt: The oscillator for the current interval.
Trigt: The exponential moving average of the oscillator.
Preferences
Right-click on the MACD button in your Indicator toolbar and select MACD Settings. The Preferences Tab will open in the Control Panel and the MACD preferences will be displayed. (Once you click on the chart, the Preference tab will go back to chart settings.)
Restore Settings: TNT Default will change your settings back to the original software settings. My Default will change current settings to your personalized default settings. Apply To All Charts will apply your selected settings on all open charts. Save As My Default will save your current personal settings.
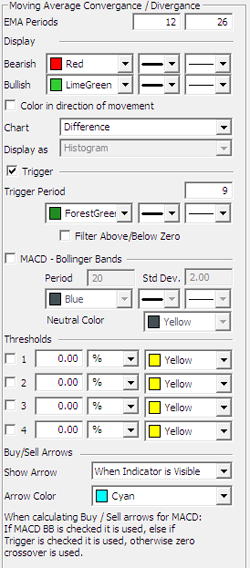
EMA Periods: The first box is used to specify the first EMA with a default of 12. The second box is for the second EMA with a default of 26.
Bearish/Bullish: Choose the color, line style, and line thickness of your line.
Color in direction of movement: Instead of changing bullish/bearish color at the zero line crossover, change it when the indicator is going up or down.
Chart: Switch between MACD, Difference and Both charting modes as defined previously.
Display as: The MACD indicator can be displayed differently. From the dropdown menu, choose either to view it as a line or as a histogram.
Trigger: Check this box to hide the Trigger line. You can also change the color and line style of the Trigger.
Trigger Period: Specify the number of days.
MACD: Bollinger Bands: See MACD Bollinger Bands.
Calculation: Select "Standard" or "Extra Smoothing" to choose how you would like your chart to be calculated. (Extra Smoothing is a proprietary formula developed by Lan H. Turner, president and CEO of Gecko Software, Inc. This method increases the movement in the MACD indicator and has shown to be more accurate [in Gecko Software's market testing] than the standard calculation. Its relationship to the MACD is similar to the relationship between the Fast and Slow Stochastics, think of this indicator as the "Fast MACD.")
View up to four Thresholds at values and colors of your choice. Choose when you want Buy/Sell Arrows to show and what color.