You are here
Price Volume Oscillator (PVO)
The PVO is primarily used to identify periods of expanding or contracting volume.
Centerline Crossovers: The PVO oscillates above and below the zero line. A PVO above zero indicates that volume levels are generally above average and relatively heavy. When the PVO is below zero, volume levels are generally below average and light. When PVO is positive, the shorter EMA of volume is greater than the longer EMA of volume. When PVO is negative, the shorter EMA of volume is less than the longer EMA of volume.
Directional Movement: The general overall direction of the PVO gives the trader a visual of market momentum and direction. A rising PVO signals volume levels are increasing, and a falling PVO signals volume levels are decreasing.
Moving Average Crossovers: The last variable in the PVO forms the signal line. For example, PVO (12,26,9) would include a 9-day EMA of PVO as well as a histogram representing the difference between the PVO and its 9-day EMA. When PVO moves above its signal line, volume levels are generally increasing. When PVO moves below its signal line, volume levels are generally decreasing.
Movements in the PVO are completely separate from price movements. Movements in PVO can correlate with price movements to assess the degree of buying or selling pressure.
Calculation
The calculation of PVO is here:
Volume Oscillator (%) - PVO = [(Vol 12-day EMA - Vol 26-day EMA)/Vol 12-day EMA] x 100
Increasing and decreasing the exponential moving average variables changes the PVO to reflect a longer or shorter trading time period. The absolute values of the PVO indicator are not as important as the crossovers of the moving averages as well as a crossover above or below the zero line.
There are three additional methods on the next page of acquiring market strength and weakness information from the PVO.
- When the PVO crosses above the zero line, volume is increasing and an increase in price is anticipated.
- When the PVO crosses below the zero line, volume is decreasing and a decrease in price and a weakening market are anticipated.
- Simple directional movement can be one of the greatest strengths of the PVO indicator. When the line is ascending, volume is increasing, so therefore markets should increase. When the line is descending, volume is decreasing, therefore the market should weaken and decrease.
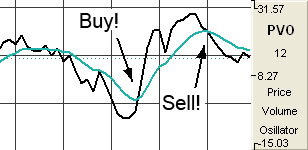
Buy/Sell Signals
A buy signal occurs when the PVO line crosses from below the trigger line to above the trigger line. A sell signal occurs when the PVO line crosses from above the trigger line to below the trigger line.
Preferences
Right-click on the PVO button in your Indicator toolbar and select PVO Settings. The Preferences Tab will open in the Control Panel and the PVO preferences will be displayed. (Once you click on the chart, the Preference tab will go back to chart settings.)
Restore Settings: TNT Default will change your settings back to the original software settings. My Default will change current settings to your personalized default settings. Apply To All Charts will apply your selected settings on all open charts. Save As My Default will save your current personal settings.
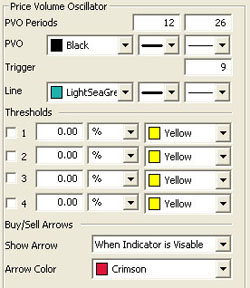
PVO Periods: Specify the number of days to be used in calculating the PVO.
PVO: Choose the color, line style, and line thickness of your line.
Trigger: Specify the number of days used in calculating the trigger period.
Line: Choose the color, line style, and line thickness of your trigger line.
View up to four Thresholds at values and colors of your choice. Choose when you want Buy/Sell Arrows to show and what color.