You are here
Triple Exponential Average (TRIX)
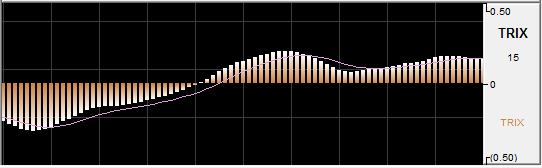
The TRIX indicator is a momentum indicator designed to calculate the percent rate of change of a triple exponentially smoothed moving average. It is very similar in the way the MACD indicator works. Both indicators provide basically the same methodology behind generating market momentum and directional movement.
TRIX was designed to filter out the minor, less significant moves within a market trend. This is done, just as other traditional indicators have done in the past, by utilizing multiple moving averages.
Convergence and Divergence are common uses of the TRIX indicator. Adding the trigger line crossover provides the trader with a Buy/Sell Signal generated from the crossing of the two moving averages.
Calculation
To calculate TRIX, first pick a period with which to create an exponential moving average of the closing prices. For a 15-day period the calculations would look like this:
Calculate the 15-day exponential moving average of the closing price.
Calculate the 15-day exponential moving average of the moving average calculated in step #1.
Calculate the 15-day exponential moving average of the moving average calculated in step #2.
The result is triple exponentially smoothing the moving average of closing prices, greatly reducing volatility.
Finally, calculate the 1-day percent change of the moving average calculated in step #3.
Buy/Sell Signals
A buy signal occurs when the TRIX value crosses from below the trigger line to above the trigger line. A sell signal occurs when the TRIX value crosses from above the trigger line to below the trigger line.
Preferences
Right-click on the TRIX button in your Indicator toolbar and select TRIX Settings. The Preferences Tab will open in the Control Panel and the TRIX preferences will be displayed. (Once you click on the chart, the Preference tab will go back to chart settings.)
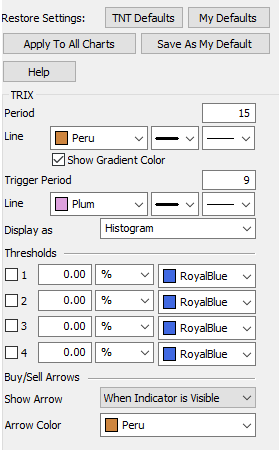 Restore Settings: TNT Default will change your settings back to the original software settings. My Default will change current settings to your personalized default settings. Apply To All Charts will apply your selected settings on all open charts. Save As My Default will save your current personal settings.
Period: Specify the number of days to be used in calculating the SRSI.
Line: Choose the color, line style, and line thickness of your line.
Show Gradient Color: Toggle gradient color shading on or off.
Trigger Period: Specify the number of days used in calculating the Underlying RSI.
Line: Choose the color, line style, and line thickness of your trigger line.
Display as: Choose if you want to see a histogram or line.
View up to four Thresholds at values and colors of your choice.
Choose when you want Buy/Sell Arrows to show and what color.