You are here
Know Sure Thing (KST)
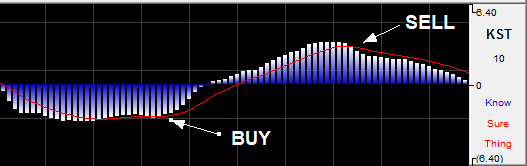
The Know Sure Thing (KST) Indicator is an oscillator developed by Martin J. Pring that gives bullish and bearish momentum signals. The difference between this indicator and other oscillators is that it takes into consideration four time periods instead of only one. Each time period is smoothed using a moving average. Also, each time period is weighted differently depending on length, so a longer time period would have greater weight. Because of the consideration of the various time periods, the KST is able to react quicker to price moves.
Watch for bullish and bearish momentum signals in the KST indicator. When the KST turns upward, this is a bullish signal, and when the KST turns down, this is a bearish signal. More confirmation is given when the trigger line crosses the KST line as a result of the change in direction.
There are two lines: the trigger line and the KST line. The KST line is a result of the four moving averages smoothed as well as the Rate of Change or ROC. The trigger line is a moving average of the KST.
Buy/Sell Signals
A buy signal will appear when the red Trigger line crosses below the KST histogram. A sell signal will appear when the red Trigger line crosses above the KST histogram.
Preferences
Right-click on the KST button in your Indicator toolbar and select KST Settings. The Preferences Tab will open in the Control Panel and the KST preferences will be displayed. (Once you click on the chart, the Preference tab will go back to chart settings.)
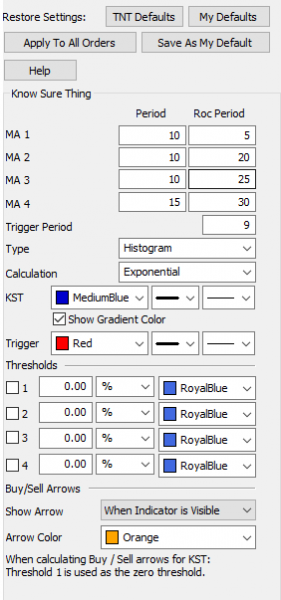 Restore Settings: TNT Default will change your settings back to the original software settings. My Default will change current settings to your personalized default settings. Apply To All Charts will apply your selected settings on all open charts. Save As My Default will save your current personal settings.
MA: Specify the number of days used in calculating the period and ROC period of the 1, 2, 3, and 4 moving average lines.
Trigger Period: Specify the number of days used in calculating the trigger period. Choose between a histogram or line.
Type: Choose if you would like to see KST as a histogram or line.
Calculation: Choose between Simple, Linear Weight, and Exponential.
Show Gradient Color: Toggle gradient color shading on or off.
KST/Trigger: Choose the color, line style, and line thickness of your KST and trigger lines.
View up to four Thresholds at values and colors of your choice. Choose when you want Buy/Sell Arrows to show and what color.