You are here
Relative Strength Index (RSI)
The RSI was developed by J. Welles Wilder, Jr., as a measure of the market's strength or weakness. The principle idea of this study is that it will indicate a general zone that the market is in, either the buy zone or the sell zone. This indicator is similar to Stochastics in that it shows regions of overbought and oversold. This indicator should be incorporated into a system rather than using it by itself. Wilder's popular indicator is known for its accuracy and its ability to compensate for erratic price movement.
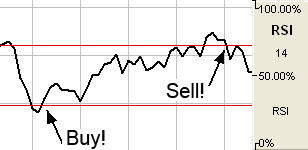
RSI computes the difference in recent prices as a solid line and plots this line on a scale similar to the scale used by Stochastics. The area above 70 is generally considered to be the overbought region, and the region below 30 is referred to as the oversold region. Simply selling in the overbought region and buying when the RSI is in the oversold region is not a consistent method of trade. Trade signals are not generated until the RSI leaves these regions. A sell signal would not be present until the RSI has begun sloping down and leaves the 70 region.
A buy signal, in the simple methodology associated with this pattern, is derived when RSI leaves the oversold region, crosses from below 30 to above it. Just like sell signals, RSI buy signals are present when the market begins to turn and the indicator leaves the oversold region.
Another use of the RSI is to look for a divergence in prices, in the case of a market making higher highs or lower lows and the RSI failing to follow suit. This difference in the indicator and the market could be a signal that the market lacks the momentum to continue its current price direction. So, you may be able to take a position sooner using this strategy, than you would with the previous way. Wilder says that this divergence is "the single most indicative characteristic of the RSI."
In its calculation the RSI indicator uses a moving average of price changes over the period. You can select which type of moving average is used to produce the desired amount of smoothing on the RSI indicator.
Calculation
The RSI computations are not difficult, but they are tedious. You first calculate the difference between the current closing price and the previous closing price:
DIFt = Closet - Closet-1
If that difference is a positive value, then it is an up period, which means the current close is higher than the previous close. If the difference is negative, then it is a down period, which means the current close is below the previous close. The DOWN value is always a positive number for all computations. It is the absolute value of a negative DIF. The worksheet on the next page shows the calculations needed to create a 9 period RSI.
| Day | Current Close | Previous Close | Dif | Up | Down |
| 1 | 7450 | 7430 | +20 | 20 | 0 |
| 2 | 7460 | 7450 | +10 | 10 | 0 |
| 3 | 7470 | 7460 | +10 | 10 | 0 |
| 4 | 7480 | 7470 | +10 | 10 | 0 |
| 5 | 7485 | 7480 | +5 | 5 | 0 |
| 6 | 7490 | 7485 | +5 | 5 | 0 |
| 7 | 7480 | 7490 | -10 | 0 | 10 |
| 8 | 7470 | 7480 | -10 | 0 | 10 |
| 9 | 7455 | 7470 | -15 | 0 | 15 |
| Totals | 60 | 35 |
You now compute the up and down averages:
Ut = (UP1 +... + UPn) / n
Dt = (DOWN1 +... + DOWNn) / n
UT: The up average for the current period.
DT: The down average for the current period.
UPn: The UP value for the nth period.
DOWNn: The DOWN value for the nth period.
n: The number of periods for the RSI.
Use the values from the worksheet to find the up average:
U = 60 / 9
= 6.67
Use the same values to find the down average:
D = 35 / 9
= 3.89
The general formula for the RSI:
RSIt = ( UT / (UT + DT) ) x 100
Use the general formula with the above values:
RSI = ( 6.67 / ( 6.67 + 3.89 )) x 100
= 63.16
Assume the market continues the downward trend. The next DIF value is -15, which sets the UP value to 0 and the DOWN value to 15. Calculate the next up and down average by using Wilder's accumulative moving average technique:
UT = ( (UT-1 x (n-1) ) + UPt) / n
= ( (6.67 x (9 -1) ) + 0) / 9
= 5.93
DT = ( ( DT-1 x (n-1) ) + DOWNt) / n
= ( ( 3.89 * (9 - 1) ) + 15) / 9
= 5.12
The value for the new RSI equals 53.67:
RSI = ( (5.93) / (5.93 + 5.12)) x 100
= 53.67
Buy/Sell Signals
A buy signal occurs when the RSI line crosses from below the lower threshold to above the lower threshold. A sell signal occurs when the RSI line crosses from above the upper threshold to below the upper threshold.
Preferences
Right-click on the RSI button in your Indicator toolbar and select RSI Settings. The Preferences Tab will open in the Control Panel and the RSI preferences will be displayed. (Once you click on the chart, the Preference tab will go back to chart settings.)
Restore Settings: TNT Default will change your settings back to the original software settings. My Default will change current settings to your personalized default settings. Apply To All Charts will apply your selected settings on all open charts. Save As My Default will save your current personal settings.
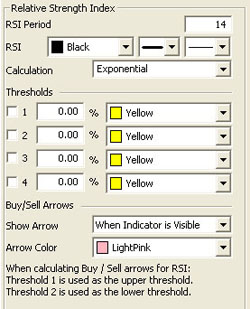
RSI Period: The number of bars, or period, used to calculate the study. Default is 14.
RSI: Choose the color, line style, and line thickness of your line.
Calculation: Choose between Exponential, Simple, and Wilder's Smoothing calculations.
View up to four Thresholds at values and colors of your choice. When calculating buy/sell signals, Threshold 1 is used as the upper threshold and Threshold 2 is used as the lower threshold (default values set at 70 and 30).
Choose when you want Buy/Sell Arrows to show and what color.