You are here
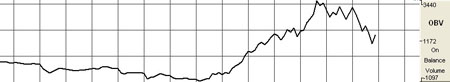
On Balance Volume (OBV)
The OBV indicator adds a period volume when the close is up and then subtracts the period's volume when the indicator closes down. An accumulated volume total forms the OBV line. When comparing this calculated price line, with the underlying security, we look for areas of convergence and divergence to confirm our market's directional movement.
The concept behind the OBV is that changes will be reflected in the OBV prior to the markets change. A rise in volume is meant to indicate a rise in money inflows to the security. Once the public continues to add money, the price of the equity should continue to rise.
Directional movement in the indicator gives foresight into the market direction. A rise in the OBV indicator gives the trader the indication that markets are on the rise; a dropping OBV is an indication of a weakening market and lower prices are soon to follow.
When market divergence is seen within the OBV indicator, one must take heed that the market is either weakening in a bullish trend, or strengthening in a bearish trend, and a market reversal is about to occur. The actual calculated value of the line itself is of little use, but the visual movement of the line is what's important to the trader. An inclining line is the indication of a strengthening market, and a declining line is representative of declining market strength.
Example of the OBV in the Indicator Window
Preferences
Right-click on the OBV button in your Indicator toolbar and select OBV Settings. The Preferences Tab will open in the Control Panel and the OBV preferences will be displayed. (Once you click on the chart, the Preference tab will go back to chart settings.)
Restore Settings: TNT Default will change your settings back to the original software settings. My Default will change current settings to your personalized default settings. Apply To All Charts will apply your selected settings on all open charts. Save As My Default will save your current personal settings.
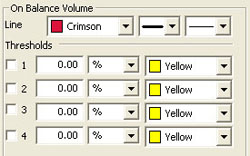
Line: Choose the color, line style, and line thickness of your line.
View up to four Thresholds at values and colors of your choice.