You are here
Introduction
Track 'n Trade 5.0 includes twenty-five indicators that are displayed in a window below the Chart Window. This window is referred to as the Indicator Window. (There are also eleven Overlay Indicators that are displayed directly on your chart in the Chart Window that are explained in the next chapter.)
Many of the indicators included in Track 'n Trade 5.0 have buy/sell signals. You will be able to select the indicator to view these signals on the chart. The indicators that have buy/sell signals are indicated by an asterisk (*) in the following list of indicators included in your program.
- AD: Williams Accumulation/Distribution*
- ATR: Average True Range
- BW: Bollinger Bandwidth
- CCI: Commodity Channel Index*
- CMF Chaikin Money Flow*
- DMI: Directional Movement Index*
- FSTO: Fast Stochastics*
- GTR: Gator
- HVOL: Historic Volatility
- KST: Know Sure Thing*
- MACD: Moving Average Convergence/Divergence*
- MFI: Money Flow Index*
- MOM: Momentum*
- OBV: On Balance Volume
- PPO: Percent Price Oscillator*
- %R: Williams Percent R*
- %B: Percent Bollinger Bands*
- PVO: Price Volume Oscillator*
- ROC: Rate of Change
- RSI: Relative Strength Index*
- SRSI: Stochastic Relative Strength Index*
- SSTO: Slow Stochastics*
- TRIX: Triple Exponential Average*
- ULT: Ultimate Oscillator*
- V/OI: Volume/Open Interest
Displaying Indicators in the Indicator Window
The Indicator Buttons are found on the bottom of your screen below the chart window. The Indicator toolbar can be closed or opened by selecting View on the Menu bar and clicking on "Indicator Buttons." Display an indicator by clicking on its corresponding button.
![]()
You can also display an indicator by right-clicking in the Indicator Window and selecting the indicator you would like to view. Select "Show All" to view all selected indicators in the Indicator Window at the same time. Selecting "Properties" will open the current indicator preferences in the Preferences tab of your Control Panel.
One Button
The One Button on the left end of your Indicator toolbar allows you to have as many indicators selected as you like, but only view them one at a time in the indicator window. To switch between each selected indicator click the Indicator Information Display to the right of the Indicator Window.
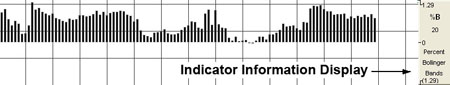
When you click on the Indicator Information Display window the indicator information will rotate to the next indicator you have selected (as simulated above).
All Button
The All Button will display all the indicators you have selected on the Indicator toolbar in the Indicator Window. You will still be able to rotate the information for each indicator to the right of the Indicator Window.
Note: The One and All buttons can be specified for each chart you have open.