You are here
Parabolic SAR (PSAR) "Parabolic Stop and Reversal"
The Parabolic SAR, developed by Welles Wilder, creator of RSI and DMI, sets trailing price stops for either long or short positions. Also referred to as the stop-and-reversal indicator, Parabolic SAR is more popular for setting stops than for establishing direction or trend. Wilder recommended establishing the trend first, and then trading with Parabolic SAR in the direction of the trend. If the trend is up, but the underlying price drops back below the trailing PSAR indicator, then sell or liquidate your long position. If the trend is down, and the underlying price rises above the trailing PSAR indicator then buy or liquidate your short position.
Calculation
Once the market establishes a direction, the initial SAR becomes the extreme price for the two intervals. The extreme price is either the lowest price or highest price for the two trading intervals. The short position uses the high, and the long position uses the low.
The calculation for the PSAR is here:
SARt = SARt-1 + [ a x ( EPtrade - SARt-1) ]
SARt: The stop and reverse price for the current interval.
SARt-1: The stop and reverse price for the previous interval.
a: The acceleration factor.
EPtrade: The extreme price for the trade.
The SAR is always the “stop and reverse” price point. This is the point you would want to liquidate your current position and establish the opposite position.
The acceleration factor, a, is a weighting factor. In Wilder’s work, the initial value for the acceleration factor is .02. The acceleration factor increases by a value of .02 each time the extreme price changes for the trade. You do not increment the acceleration factor if the extreme price fails to change. The value for a, the acceleration factor, never exceeds .20 in Wilder’s methodology.
The extreme price (EP) for the trade is the highest or lowest price achieved during the trade. If you have a long position, use the new highs as the extreme price. When you have a short position, use the new lows as the extreme price. The extreme price concept allows for normal market corrections without immediately triggering the SAR price. It keeps the SAR price moving in the direction of the market.
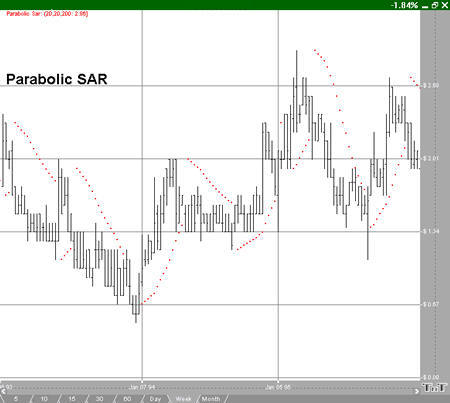
Example of PSAR
Preferences
To open the Parabolic Stop and Reversal Preferences click on the QuickLink (PSAR) in the lower right of the chart. Or you can right-click, select Overlay Properties and then Parabolic Stop and Reversal. If you click on the chart, the Preferences tab will go back to chart settings.
1. Restore Settings: TNT Default will change your settings back to the original software settings. My Default will change current settings to your personalized default settings. Apply To All Charts will apply your selected settings on all open charts. Save As My Default will save your current personal settings.
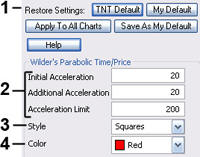 2. Initial, Additional, Limit: Specify the calculation number you would like each section of the indicator.
3. Style: Choose how you would like the indicator displayed. Select squares, crosses, dots, or lines.
4. Color: Select the color of the indicator.