You are here
Candlestick Auto-Recognition
 Japanese Candlesticks have long been a standard tool used by Japanese rice traders for centuries. Popularized in the Western world for trading Stocks, Futures & Forex, Japanese Candlesticks have become a staple indicator of almost every trader.
Track ‘n Trade’s unique method of automatically identifying, cataloging, and signaling buy and sell signals derived from various candlestick formations is unique in the fact that Track ‘n Trade gives the trader the ability to filter out, or ‘decide’ what a true candlestick must match, prior to receiving a signal.
Within Track ‘n Trade, you also have the ability to use external filters to help eliminate unwanted or overly aggressive signals, allowing for a high level of signal purification.
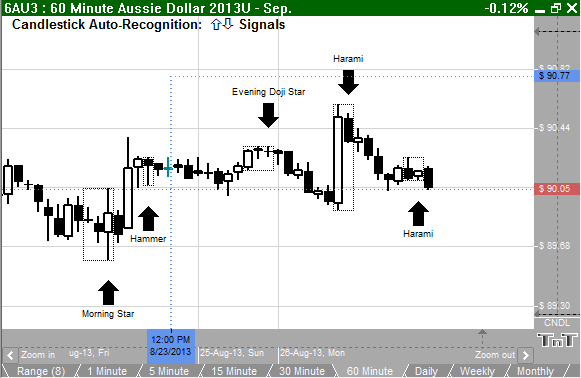
Turning on Candlestick Auto-Recognition is like turning on an overlay, right click, Chart Overlays, Candlesticks Auto-Recognition.
Example of Candlestick Auto-Recognition
Preferences
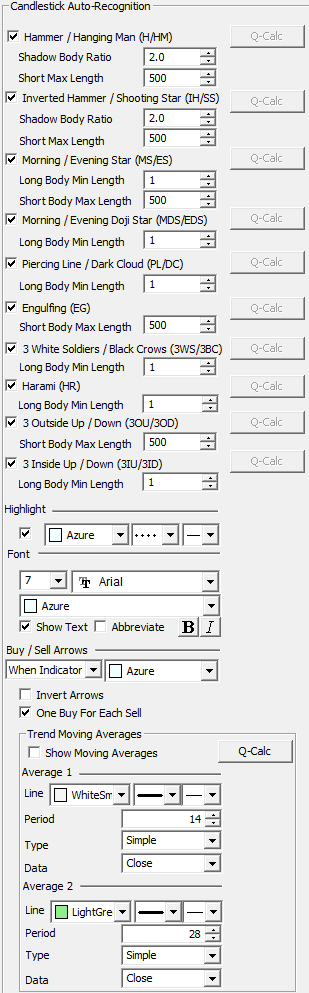
To open the Candlesticks Auto-Recognition Preferences click on the Quick Link (CNDL) in the lower right of the chart. Or you can right-click, select Overlay Properties and then Candlestick Auto-Recognition. If you click on the chart, the Preferences tab will go back to chart settings.
 The Candlestick Auto-Recognition Indicator is able to recognize a long list of patterns. Descriptions and picture examples of each are listed below in the Candlestick Pattern Examples.
The Patterns: All of the features in the patterns settings can be simplified by breaking it down into a few concepts of enabling, lengths/ratios, and the Q-Calc button.
To enable or disable a pattern, simply check or uncheck its checkbox.
All lengths are measured in minimum moves (ticks or pips). All ratios are measured in multiples of their associated length, so 2.0 is two times as long as the length.
Q-Calc: Quick Calculate any individual line for optimization through Autopilot. To activate, select Candlestick Auto-Recognition as your primary or secondary indicator in the Autopilot.
Highlight: The highlight controls the box that can optionally be drawn around the candlestick pattern. This box indicates a found pattern.
Font: Controls the font and color of on-screen patterns. You may Show/hide text or abbreviate the candlestick pattern description.
Buy/Sell Arrows: Controls the display of the arrows.
Invert Arrows: Will reverse all signals received.
One Buy For Each Sell: Will only create one buy or sell signal per trend based on overall Trend Moving Averages settings.
The Trend Moving Averages: Used by the One Buy For Each Sell filter to limit the candlestick patterns discovered and displayed so that we don't have multiple same-side signals in a row. Trend direction determined by two configurable moving averages. Select Show Moving Averages to display these within the chart window.
More information about moving averages are available within the Chart Overlays Moving Averages section.
Candlestick Pattern Examples
White / Light Candlestick refers to a candlestick which closed at a higher price than it opened.
Black / Dark Candlestick refers to a candlestick which closed at a lower price than it opened.
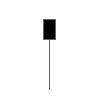 |
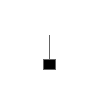
Hanging Man A black or a white
candlestick that consists of a small body near the high with a little or no upper shadow and a long lower tail. The lower tail should be two or three times the height of the body. Considered a
bearish pattern during an uptrend.
|
 |
Hammer A black or a white candlestick that consists of a small body near the high with a little or no upper shadow and a long lower tail. Considered a bullish pattern during a downtrend. |
 |
Inverted Black Hammer A black body
in an upside-down hammer position. Usually considered a bottom reversal signal.
|
 |
Inverted Hammer A black or a white candlestick in an upside-down hammer position. |
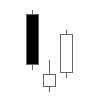 |
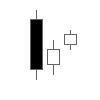
Morning Star Consists of a large black body candlestick followed by a small body (black or white) that occurred below the large black body candlestick. On the following day, a third white body candlestick is formed that closed well into the black body candlestick.
It is considered as a major reversal signal when it appears at bottom.
|
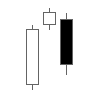 |
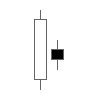
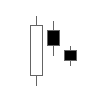
Evening Star Consists of a large white body candlestick followed by a small body candlestick (black or white) that gaps above the previous. The third is a black body candlestick that closes well within the large white body. It is considered as a reversal signal when it appears at top level. |
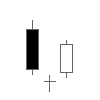 |
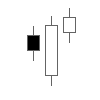
Morning Doji Star Consists of a large black body candlestick followed by a Doji that occurred below the preceding candlestick. On the following day, a third white body candlestick is formed that closed well into the black body candlestick which appeared before the Doji. It is considered as a major reversal signal that is more bullish than the regular morning star pattern because of the existence of the Doji. |
 |
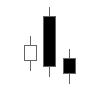
Evening Doji Star Consists of three candlesticks. First is a large white body candlestick followed by a Doji that gap above the white body. The third candlestick is a black body that closes well into the white body. When it appears at the top it is considered as a reversal signal. It signals more bearish trend than the evening star pattern because of the doji that has appeared between the two bodies. |
 |
Piercing Line Consists of a black candlestick followed by a white candlestick that opens lower than the low of preceding but closes more than halfway into black body candlestick. It is considered as reversal signal when it appears at bottom. |
 |
Dark Cloud Cover Consists of a long white candlestick followed by a black candlestick that opens above the high of the white candlestick and closes well into the body of the white candlestick. It is considered as a bearish reversal signal during an uptrend. |
 |
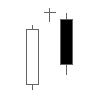
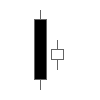
Engulfing Bearish Line Consists of a small white body that is contained within the followed large black candlestick. When it appears at top it is considered as a major reversal signal. |
 |
Engulfing Bullish Line Consists of a small black body that is contained within the followed large white candlestick. When it appears at bottom it is interpreted as a major reversal signal. |
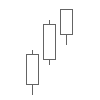 |
Three White Soldiers Consists of three long white candlesticks with consecutively higher closes. The closing prices are near to or at their highs. When it appears at bottom it is interpreted as a bottom reversal signal. |
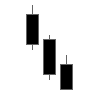 |
Three Black Crows Consists of three long black candlesticks with consecutively lower closes. The closing prices are near to or at their lows. When it appears at top it is considered as a top reversal signal. |
 |
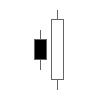
Bullish Harami Consists of an unusually large black body followed by a small white body (contained within large black body). It is considered as a bullish pattern when preceded by a downtrend. |
 |
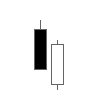
Bearish Harami Consists of an unusually large white body followed by a small black body (contained within large white body). It is considered as a bearish pattern when preceded by an uptrend. |
 |
3 Outside Up Consists of a black candlestick followed by a large body white candlestick with its high and low engulfing the previous bar. It is considered as a bullish pattern when the third candle closes higher. |
 |
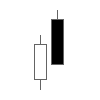
3 Outside Down Consists of a white candlestick followed by a large body black candlestick with its high and low engulfing the previous bar. It is considered as a bearish pattern when the third candle closes lower. |
 |
3 Inside Up Consists of a large body black candlestick followed by a small body white candlestick which is engulfed within the high and low of the previous candlestick. It is considered as a bullish pattern when the third candle closes higher. |
 |
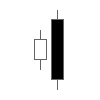
3 Inside Down Consists of a large body white candlestick followed by a small body black candlestick which is engulfed within the high and low of the previous candlestick. It is considered as a bearish pattern when the third candle closes lower. |