- Getting Started
- Control Panel
- Toolbars
- Basic Tools
- Standard Tools
- Crosshair Tool
- Line Tool
- Multi-Line Tool
- Arc Tool
- Bar Calculator Tool
- 123 / ABC Tool
- Head & Shoulders Tool
- Dart Tool
- Wedge Tool
- Trend Fan Tool
- Trend Channel Tool
- Raff Regression Channel Tool
- Horizontal Channel Tool
- N% Ruler Tool
- Arrow Tool
- Text Tool
- Box Tool
- Circle Tool
- Dollar Calculator
- Risk vs. Reward Calculator
- Place Order Tool
- Advanced Technical Tools
- Customize the Toolbars
- Chart Overlay Indicators
- Indicator Windows
- Plug-Ins
- End User License Agreement(EULA)
- Gecko Software Risk Disclosure
You are here
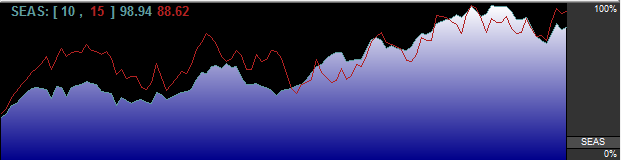
SEAS - Seasonal Trend Indicator
The seasonal trend indicator represents the "normal" historical behavior of the market. The indicator is calculated on the specific contract month, showing you the behavior of that specific chart. This is very important in agricultural markets with new and old crop contracts, such as Wheat or Corn.
The charts depict behavior on a relative basis; the actual prices are not forecasted, just the relative position of the market versus its contract high and low. On the seasonal charts, the high is depicted as 1.0, or 100%, while the low is depicted as 0.0, or 0%. All similar trading days are lined up for X number of years (the defaults in Track 'n Trade 5.0 are 10 years for Trend 1, and 15 years for Trend 2) and are analyzed in terms of where each day falls as a percentage of the highest and lowest price of either the last 12 months or the life of the contract for each specific contract. These prices are then averaged and depicted in the indicator window. When the trend line is at 100% or 1.0, it indicates where the contract has, on average, been at its highest value for a specified time range and scale period.
When the trend line is at 0% or 0.0, it indicates where the contract has, on average, been at its lowest value for the specified time range and scale period. The averages use data from all previous years and are not affected by the current year's trend.
Displaying the Seasonal Trend Indicator
To open the Seasonal Trend Indicator right click on the chart and select Add Indicator Window and then SEAS (Daily Charts Only) Seasonal Trend. Or right-click in an indicator window and select SEAS (Daily Charts Only) Seasonal Trend.
Example of Seasonal Trend Indicator
Preferences
Open the Preferences Tab in your Control Panel. Select the SEAS quick link at the right of the indicator window. (Once you click on the chart, the Preference tab will go back to chart settings.)
Restore Settings: TNT Default will change your settings back to the original software settings. My Default will change current settings to your personalized default settings. Updates all SEAs will apply your selected settings on all open charts. Save As My Default will save your current personal settings.
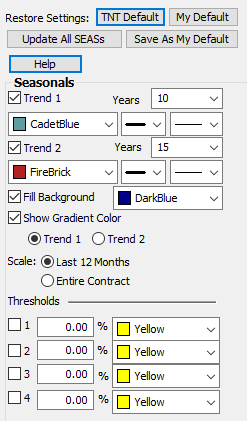 Trend 1,2: Select how many years you would like to view and what color, line thickness, and line style you would like the indicator to be. You can also choose
Fill background and choose the color and which trend you would like it to be applied to.
Show Gradient Color: Toggle gradient color shading on or off.
Scale: Decide if you would like the indicator to be based on the Entire Contract or the Last 12 Months.
Thresholds: View up to four thresholds at a value that you type in and a color that you choose.