You are here
50% Retracements - Technical Analysis
Markets move in waves called retracements. These waves have up and down trends.
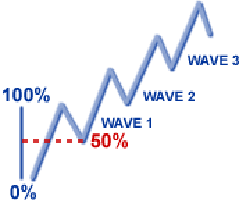 Up Trend (Bull Market)
In the diagram to the left, the market is in an overall uptrend; however, within the uptrend are small areas where the market falls back, or "retraces," each time establishing a new higher high.
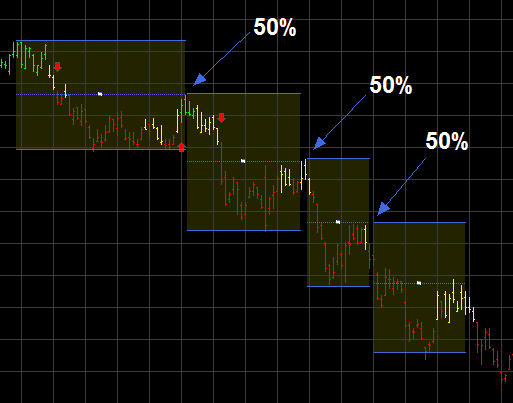 Down Trend (Bear Market)
This chart shows how the market made lower highs and lower lows, while still maintaining the overall down trend. Each retracement was about 50% of the last move before they continued on in their original direction.
Markets have a tendency to retrace half of the last move in overall long-term trends.