- Getting Started
- Control Panel
- Toolbars
- Chart Overlay Indicators
- Indicator Windows
- Plug-Ins
- End User License Agreement(EULA)
- Gecko Software Risk Disclosure
You are here
Graph
Equity Performance Graph
Clicking the Graph button will bring up a line graph on the bottom-half of your screen that will allow you to see how your Autopilot settings would have done over any given period of time (as set in dates listed by the user).
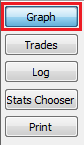
By right-clicking in the graph window, you receive a right-click menu, where you can make visual adjustments to the chart. You can select whether you would like to see the graph displayed as a line or histogram, whether the line chart is filled, and if you want to exclude the initial balance (Profit/Loss Only).