You are here
Toolbars
Each toolbar can be customized to fit your trading needs. To customize a toolbar, place mouse over the toolbar and right click, then select Customize Toolbar.
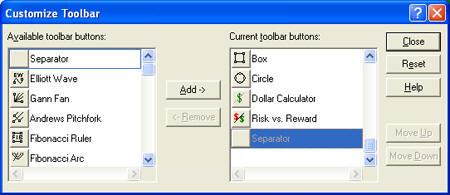
To add buttons, select desired buttons and click Add. To delete unwanted buttons, select and click Remove. To restore default buttons, click Reset. When you have made your changes, select Close to save your changes and return to the program.
Main Toolbar

New: Closes your current chartbook and opens a new chartbook. Open: Closes your current chartbook and opens a window for you to choose a previously saved chartbook. Save: Saves your open charts as a chartbook. Print: Prints the Chart Window. Help: Click on this button, then click anywhere in the software to learn more about that feature.
Navigation Toolbar

Pointer: Default tool used for selecting tools and features in the software. Magnifier: Used to zoom in on a section of your chart. You can click and drag to select an area to zoom in on or simply click on the center of the chart to zoom in. To zoom out, hold down the Alt key and click on the chart. Hand: Scrolling tool used in chart window. Click and drag a chart to scroll.
Charting Toolbar

Crosshair Tool: Used to draw a line vertically and horizontally on a chart. Line Tool: Used to draw support and resistance lines. Multi-Line Tool: Used to draw an alternating support and resistance line. Arc Tool: Used to illustrate a rounded top or bottom formation. Day Offset Tool: Measures the number of trading days vs. actual days that are between two points. 123 Tool: Used to chart a 123 top or bottom formation. Head & Shoulders Tool: Used to chart a Head & Shoulders top or bottom formation. Dart/Blip Tool: Used to chart a Dart/Blip up or down formation. Wedge Tool: Used to identify any type of wedge or triangle. Trend Fan Tool: Used to identify a Trend Fan. Trend Channel Tool: Used to identify an inclining or declining channel. Horizontal Channel Tool: Used to identify a horizontal channel. N% Ruler: Used to measure a retracement. Default is 50%.
Notation Toolbar
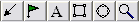
Arrow Tool: Used to draw arrows to help point out areas of interest. Flag Tool: Used to place a flag or graphic. Text Tool: Used to type text. Box Tool: Used to draw a box. Circle: Used to draw a circle.
Calculators Toolbar

Dollar Calculator: Used to find the dollar value between two points on the chart. Risk/Reward: Used to find the difference between two points of the risk and reward zone.
Advanced Charting Toolbar

The Advanced Technical Tools only appear if you have the Advanced Technical Tools Expansion Pack, which includes the Elliott Wave Tool, the Gann Fan Tool, the Andrews Pitchfork Tool, the Fibonacci Ruler, the Fibonacci Arc Tool, and the Fibonacci Time Zones.
Time Interval Toolbar
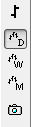 Daily Chart: Each price bar represents a day.
Weekly Chart: Each chart price bar represents a week.
Monthly Chart: Each chart price bar represents a month. The following buttons are integrated with the Time Interval Tabs found on the bottom of a chart at full screen.
Screen Capture: Saves your open chart as an image. Holding down Alt while you click this button will save the chart and control panel to file. Ctrl-click will copy the screenshot to your clipboard (making it ready to paste). Ctrl-Alt-click will copy your chart window plus your control panel to your clipboard.