You are here
10x8 Moving Average Calculation
Just as it is easier to ride a bike downhill than uphill, it seems prices fall faster than they rise. Due to this perceived quirk in pricing, the legendary market analyst, author, and seminar speaker, Jake Bernstein, developed the 10x8 moving average system.
This system uses two simple moving averages, but they are calculated in a slightly different manner than those traditionally used. The first moving average is a moving average of the daily highs, as opposed to that of the daily settlement. The second moving average is calculated using the daily lows.
Though Mr. Bernstein recommends using a 10 period moving average of the daily highs and an 8 period moving average of the daily lows based on his observation that prices tend to fall about 20% faster than they rise, any combination would do the trick. Generally, accepting market lore that prices fall faster than they rise, the moving average of the lows should be of shorter term duration than that of the highs.
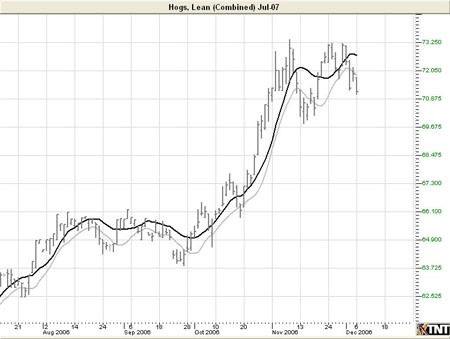
The most basic use of the 10x8 Moving Average is to look for a breakout above the upper moving average to initiate a buy signal. When the daily settlement price exceeds the average high of the last 10 days, this indicator flashes a buy signal indicating that the trend of the market should be up.
Example of a 10x8 MAC
Preferences
Right-click anywhere on the chart and go to "Overlay Properties." Select 10x8 MAC from the list. The preferences will appear in the Control Panel. (Once you click on the chart, the Preference tab will go back to chart settings.)
Restore Settings: TNT Default will change your settings back to the original software settings. My Default will change current settings to your personalized default settings. Apply To All Charts will apply your selected settings on all open charts. Save As My Default will save your current personal settings.
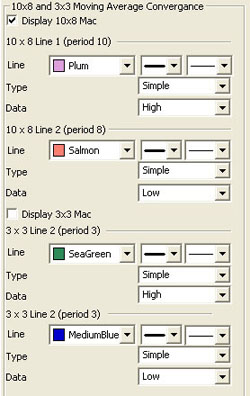
Display 10x8 MAC, 3x3 MAC: Check the boxes to display the lines you would like to see.
Line: Choose the color, line style, and line thickness of your indicator line.
Type: Select Simple, Linear Weight, or Exponential.
Data: Select Open, High, Low, Close, Mean, Median, or Mode.