You are here
Introduction
Track 'n Trade 5.0 generates weekly and monthly long-term charts from more than 30 years of historical data. Open the chart you would like to view as a long term chart. The chart is automatically set to open as a daily chart for the month you specified. Click on the appropriate button to the right of the chart window to view a Daily, Weekly, or Monthly Long Term chart.
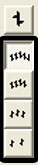 |
Center Chart: Centers the chart in your chart window how it is right now. Clicking on this button will not autoscale your chart if you play it forward or backward. |
| Daily Chart: Sets your current chart so each price interval represents one day. | |
| Long Term Daily: Sets your current chart as daily, but includes all available data. | |
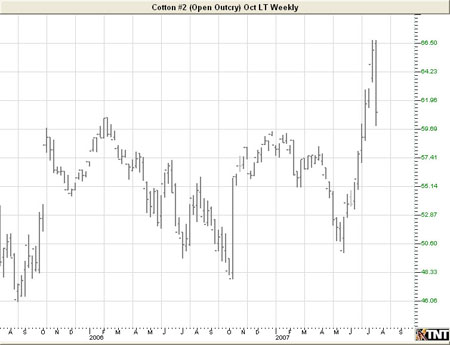
| Long Term Weekly: Sets each price interval as one week. | |
| Long Term Monthly: Sets each price interval as one month. |
Comparison of Chart Ticks
| Chart | Price Interval Represents | Open | High | Low | Close |
|---|---|---|---|---|---|
| Daily | One Day | Day's Open | Day's High | Day's Low | Day's Close |
| Weekly | One Week | 1st Day's Open | High for the Week | Low for the Week | Last Day's Close |
| Monthly | One Month | 1st Day's Open | High for the Month | Low for the Month | Last Day's Close |
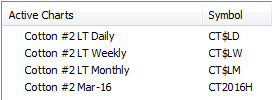 When you click on the Daily Long Term button, the new chart will open in the chart window. The chart will also be listed as a new chart in your control panel under Active Charts. The symbol will be generated by using the commodity symbol followed by a dollar sign and LD for Long term Daily (Example: Cotton #2 would be CT$LD). Weekly Long Term and Monthly Long Term symbols will be generated the same way with commodity symbol, a dollar sign, and the month letter followed by LW for weekly or LM for monthly (Example: Cotton #2 for Long Term Monthly would look like CT$VLM).
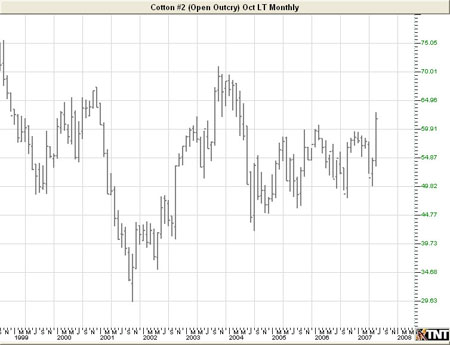
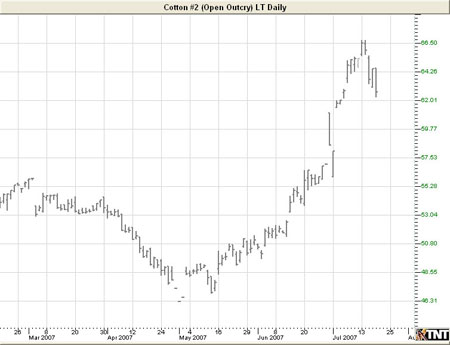
Examples of Long Term Charts using Cotton #2
Long Term Daily
Long Term Weekly
Long Term Monthly