You can specify how your chart looks by using the Preferences tab in your Control Panel or by right-clicking in your chart window and using selections from the dropdown menu.
Chart Window Right-click Menu
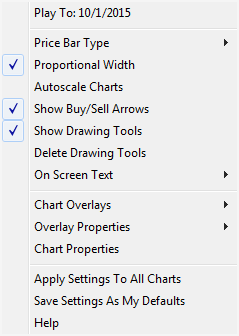 Proportional Width
 will make your price bar width proportional to the scale of your chart.
Autoscale Charts forces the chart to scale the price bars displayed in the chart window based on the highest and lowest point available in this set of price bars. It will rescale the chart as you go forward or backward in time. (If you would like to center your chart without turning on the Autoscale feature, click on the Center button in your Time Interval toolbar.)
Show Buy/Sell Arrows to view Buy and Sell arrows on your chart. If this option is not selected, buy and sell arrows will not appear on your chart even if you have an indicator selected that has buy and sell signals.
Show Drawing Tools to view all the drawings you've made on your chart. Deselecting this option will not delete the drawings. Once you re-select this option, your drawings will reappear on your chart.
Chart Properties displays the chart preferences within your control panel.
When you highlight Price Bar Type, a menu will appear to the right of the dropdown window. From here, you can select which style of price bars you would like to appear on your chart.
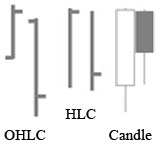 OHLC:
OHLC: will show the open, high, low, and close tick marks for the day.
HLC: will be the same, without the initial open tick.
Close: will take the closing prices for each day and turn your chart into a line graph.
Close EX: stands for Close Extended. It will look like Close with the close price as an extended horizontal line.
Candle: will show your price pars as candlesticks. (Candlesticks are explained in the Candlesticks chapter at the end of the manual.)
None: will remove all price bars, showing only your on screen technical analysis.
Preferences Tab
The Preferences tab is located in the Control Panel. Chart preferences appear in the window by default. When your preferences tab is open, click in the chart window and the chart preferences will appear. In this tab, you can customize every detail of how your chart looks. You can specify colors and sizes of all the features on your chart.
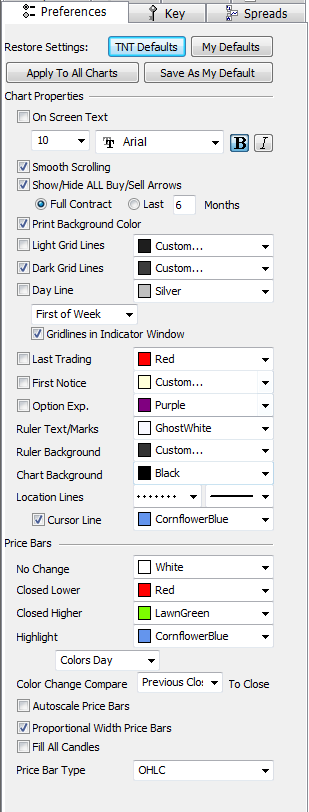 TNT Defaults:
 change your settings back to the original software settings.
My Defaults: change current settings to your personalized default settings.
Apply To All Charts: apply your selected settings on all open charts.
Save As My Default: save your current personal settings as your new default settings.
On Screen Text: display OHLC and active chart overlay values.
Smooth Scrolling: adjust how the chart scrolls while using the play and rewind controls.
Show/Hide ALL Buy/Sell Arrows: Hide all arrows or show only arrows for the most recent number of months chosen.
Print Background Color: When printing charts, hide the black chart background to conserve ink.
Light Grid Lines: Will add additional, lighter grid lines to your chart window.
Dark Grid Lines: Default grid lines, adjust the color or uncheck to disable.
Day Line: Grid line to mark a weekday, week start/end or monthly separation.
Grid Lines in Indicator Window: Display grid lines in indicator window.
Last Trading: Highlight last trading day in chart window.
First Notice: Highlight first notice day in chart window.
Options Exp: Highlight options expiration day in chart window.
Ruler Text/Marks: Change ruler text color.
Ruler Background: Change ruler background color.
Chart Background: Change chart background color.
Location Lines: Change appearance cursor location line.
Cursor Lines: Highlight to display ruler cursor location, uncheck to hide.
Price Bars: Change price bar default color for bars which have No Change, Closed Lower or Closed Higher than the previous bar. *Overridden by Bulls 'n Bears.
Highlight: Keyboard Caps Lock cursor highlight appearance in chart.
Color Change Compare: Change what determines price bar color.
Autoscale Price Bars: Autoscale all price bars within the chart window
Proportional Width Price Bars: Scale price bars by width within chart grid.
Fill All Candles: Create Candlestick bars without white/hollow appearance
Price Bar Type: Change your price bar appearance in the chart.
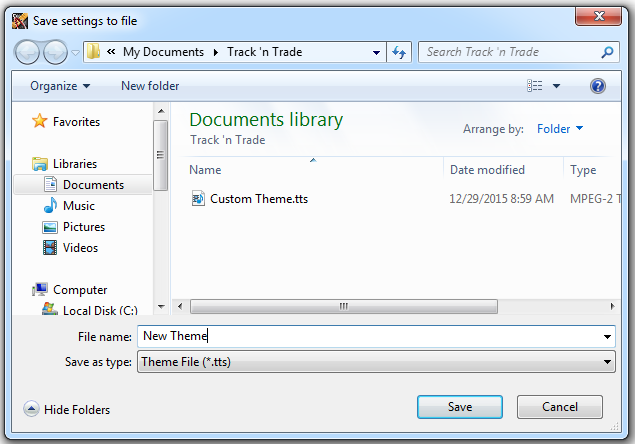
Themes
Track 'n Trade 5.0 gives you the ability to save your personal settings as a theme. With different themes, you can apply many pre-set characteristics quickly to a chart. When you have your settings how you like them, select Save Themes from your View menu. The Save settings to file window will appear. Choose where you would like your themes to be saved, name your theme, and click on "Save."
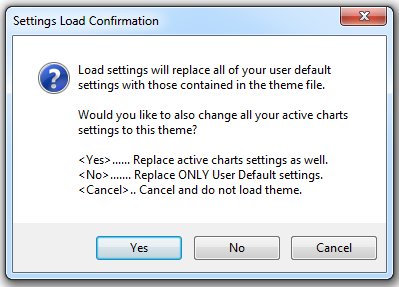
Select Load Themes from your View menu to apply a saved theme. The Settings Load Confirmation window will appear. Click Yes if you want to replace all user default settings with your theme and have your theme apply to all active charts. Click No if you only want to replace your user default settings with your theme, but don't want your theme to apply to your active charts. Clicking Cancel will exit the window and no theme will be applied. The Open window will appear if you select Yes or No. Find your saved theme and click "Open."