You are here
Line Tool
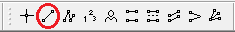
To draw a support or resistance line, also referred to as a trend, use the Line tool. Select the Line tool from your Charting toolbar. Click on your chart where you want the line to begin. Hold down the mouse button and move to the position you want your line to end. Release mouse button to place.
Resizing the Line
Select the line drawing by clicking on it. The line is selected when boxes appear at the ends of the line. Click on one of the boxes and drag it to the desired length. Release the mouse button to place the end point of the line.
Moving the Line
Select the line drawing by clicking on it. Click on the line, not an end box, and drag the line to the new location. Release the mouse button to place.
Deleting the Line
Select the line drawing by clicking on it. Press the Del (Delete) key on your keyboard. You can also right-click the line drawing and select "Delete" from the dropdown menu.
Preferences
Select the line drawing by clicking on it. The properties will appear in the preferences section of your control panel.
Restore Settings: TNT Default will change your settings back to the original software settings. My Default will change current settings to your personalized default settings. Apply To All Charts will apply your selected settings on all open charts. Save As My Default will save your current personal settings.
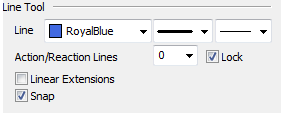
Line Tool: You can choose the color, line style, and line thickness of your line.
Parallel Extensions: Select from the dropdown menu how many lines you would like to add. Deselect Lock if you want to be able to move them independently.
Select Linear Extensions to extend your line to the edge of your chart window. Select Snap if you want your crosshair to snap to price bars when moved.
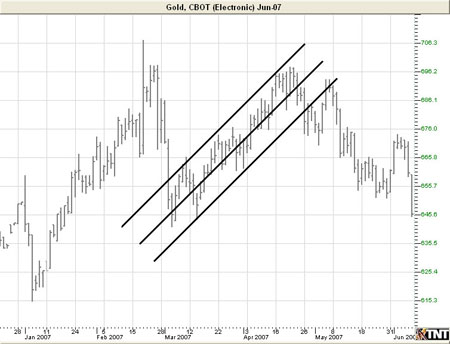
Example of the Line Tool