You are here
Volume Weighted Average Price (VWAP)
Volume Weighted Average Price (VWAP) is a technical analysis chart overlay used to measure the average price weighted by volume. VWAP is used with intraday charts as a way to determine the general direction of intraday prices. It's similar to a moving average in that when price is above VWAP, prices are rising and when price is below VWAP, prices are falling. VWAP is primarily used by technical analysts to identify market trend.
Calculation
The VWAP value is typically more sensitive to the impact as each bar’s new volume and price data is added into the calculation towards the beginning of the anchor period (i.e. trading session when set to Day) vs later in the trading session when the new volume and price data has less of an impact on overall cumulative volume weighted average price. When the Anchor Period is set to "Day" and where Data is set to "Close", the vwap value is built from the close and the volume traded, but is cumulatively building a volume weighted average price factoring in all trading activity up until that point from the start of that trading session..
For the above explanation:
Anchor Period drop-down set to "Day"
Data drop-down set to "Close"
Calculation
For settings example above, the value of VWAP for a given bar is calculated as follows:
- Take the close (c) of the each bar and multply it by the volume (v) to get "cv".
- Now, sum that value (cv) for each previous bar up to the current one, like this:
cv1 + cv2 + cv3 + cvX = cumulativeCV - Sum the volume (v) for each previous bar up to the current one:
v1 + v2 + v3 + vX = cumulativeV - Now to find the VWAP value for the bar, simply divide cumulativeCV by cumulativeV:
VWAP = cumulativeCV / cumulativeV
Instead of using the close (c), the open (o) could be used, and you would end up with this (where o is used in place of c): VWAP = cumulativeOV / cumulativeV
Data could also be set to Average. Average is used in place of c and o, but the average has to be calculated also. The average is the average of the high, low and close. It could also be called the "typical price". It is calculated for a bar in the following manner:
average = (high + low + close / 3)
VWAP = cumulativeAV / cumulativeV
Anchor period may also be set to Weekly, which means that the VWAP value and data used to calculate it is reset every week to 0. In Futures, that reset occurs when the market closes for the week. For instance, that might be 4pm on Friday. When that happens, you'll notice that VWAP value is set to the "close" value for the bar right after the last bar when the market closed.
Anchor period may also be set to Custom. Setting it to Custom causes another box to appear where a number of bars can be entered. That number is the number of bars previous that can be used to calculate the VWAP for any given bar. For instance, setting the value to 13 bars indicates that the volume and the data for the previous 13 bars of each bar is used to calculate the VWAP value for each bar. The VWAP value is calculated using "rolling" values.
Choosing a Custom anchor period also causes a drop-down box to appear for "Resets". The box allows you to choose either "Daily, Weekly, or Never". Choosing Daily causes the VWAP value to reset again to zero, meaning also the volume and data used to calculate the VWAP value starts over again with the first bar of each day.
Basically, setting the value in the "Resets" drop-down to Daily or Weekly is similar to setting the value to "Daily" or "Weekly" in the Anchor Period box, except that it allows you customize the number of bars used calculate the VWAP value.
Selecting "Never" causes the values to never reset to 0, allowing the rolling VWAP value to use previous bars' data and volume to calculate the VWAP value for each new bar.
Preferences
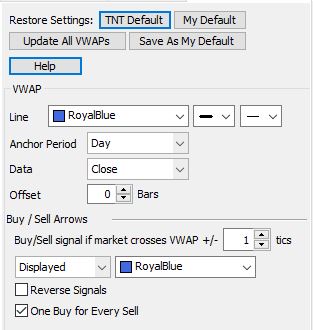
- Restore Settings: TNT Default will change your settings back to the original software settings. My Default will change current settings to your personalized default settings. Apply To All Charts will apply your selected settings on all open charts. Save As My Default will save your current personal settings.
- Line: allows you to change the color and size and fill of the VWAP line.
- Anchor Period: Select Day, Week, or Custom bars back (requires how often you want the Calculation to reset)
- Data: Select Average, Open, Close
- Offset: Use this option if you want to skew the data forward/backwards "X" number of bars
- Buy/Sell signal Determines how many tics +/- past the VWAP line the market must move before a buy/sell signal is generated.
- Buy/Sell signals Displayed: choose to display or not display buy/sell signals and what color they appear on the chart
- Reverse Signal: Select this if you want to reverse the direction of the buy/sell signals when the arrows are generated.
- One Buy for Every Sell: Select this if you want to see one buy for every sell signal, or unselect if you want to see a signal every time the criteria is met.