- Getting Started
- Control Panel
- Toolbars
- Chart Overlay Indicators
- Indicator Windows
- COT - Commitment of Traders
- PROB - Market Probability
- RBN - Ribbon
- SEAS - Seasonal Trend
- AD - Williams Accum/Dist "Williams Accumulation/Distribution"
- ATR - Average True Range
- %B - Percent Bollinger Bands
- BW - Bollinger Bandwidth
- CCI - Commodity Channel Index
- CMF - Chaikin Money Flow
- DMI - Directional Movement Index
- FSTO - Fast Stochastics
- GTR - Gator Oscillator
- HVOL - Historic Volatility
- KST - Know Sure Thing
- MACD - Moving Average Convergence/Divergence
- MFI - Money Flow Index
- MOM - Momentum
- OBV - On Balance Volume
- PPO - % Price Oscillator
- PVO - % Volume Oscillator
- %R - Williams' %R "Williams Percent R"
- ROC - Rate of Change
- RSI - Relative Strength Index
- SRSI - Stochastic Relative Strength Index
- SSTO - Slow Stochastics
- TRIX - Triple Exponential Average
- ULT - Ultimate Oscillator
- VOL - Volume
- Plug-Ins
- End User License Agreement(EULA)
- Gecko Software Risk Disclosure
You are here
Moving and Scaling a chart
In-Chart Zoom
1) Click and drag horizontal onscreen = zoom in/out horizontal.
2) Click and drag Vertical = vertical zoom in/out.
3) Click and drag Diagonal = zooms in on highlighted section.
4) First double-click after scaling/zooming square, Autoscales the viewable section. The Second double-click zooms out to chart default.
5) Holding left mouse down for 1.5 seconds changes cursor to the directional movement cursor to grab the chart and move it once and letting up changes back to the pointer cursor.
6) Clicking the directional movement button from the icon bar turns it on so you can grab & move (maneuver) around the chart. To turn it off simply double-click (left mouse) or right-click one time. Or you may also click the pointer icon from the icon bar to turn off (or click a different icon to do something else which also turns off the directional movement tool).
7) Note only the horizontal scaling works down in the indicator window area & only the vertical scaling works in the right margin to the right of (beyond) the price bars.
8) You can move the chart itself up or down (vertically) by using the scroll wheel on your mouse.
9) There are +/- buttons to Zoom/Scale on the price ruler and down on the date line in the corners. There are settings to turn them off/on from the chart preferences (currently by default they are off for multi-chart mode to save price ruler real estate and are on by default for single chart view.)
10) You can also move/scale vertically by left-clicking and holding down on the price ruler (left side of the dash line to move the chart up and down vertically & right side of the dash lines to scale the price bars taller/shorter) and down on the dateline above the dash line for horizontal moving the chart left/right and below the dash line for zooming the chart in/out.
Margin Arrows
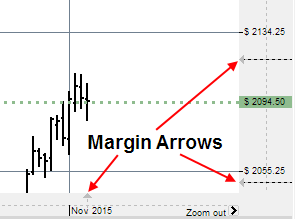
On the Ruler Bar, you will notice three Margin Arrows, two on the right price ruler and one on the bottom date ruler. These arrows are used to center your chart within these “margins.”
To move the margin click on the arrow and drag to the new location. Then click on the center chart button in the Standard Tools toolbar or right-click and choose Center Chart to resize the chart to these margins.
Scaling and Moving
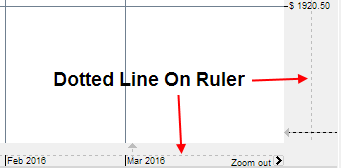
From the chart: On your ruler, you will see a dotted line splitting it in half. This is on both the Price ruler and the date ruler.
If you want to move your chart horizontally or vertically, click and drag the section of the ruler bar closest to the chart. To scale your chart horizontally or vertically (zoom in and zoom out), click and drag the section of the ruler bar farthest from the chart.
Zoom in/Zoom out: At the bottom of the chart below the dotted line, on the far left and right side are arrows labeled Zoom in and Zoom out. Clicking on these arrows will step zoom in and out.
Move the chart with the Hand Tool: You can click and drag on the chart using the Hand Tool of the Standard Tools toolbar to move the chart. Holding down Ctrl on your keyboard will activate the Hand Tool while Ctrl is pressed.