- Getting Started
- Control Panel
- Toolbars
- Chart Overlay Indicators
- Advantage Lines (ADV)
- Bull's 'n Bears, Red Green Light (BNB)
- Candlestick Auto-Recognition (CNDL)
- Historical Averages (HIST)
- Ribbon (RBN)
- Alligator (AL)
- ATR Stop (ATR) "Average True Range"
- Bollinger Bands (BB)
- Donchian Channels (DON)
- Ichimoku Kinko Hyo (IKH)
- Keltner Bands (KLT)
- Moving Averages (MA)
- Parabolic SAR (PSAR) "Parabolic Stop and Reversal"
- Pivot Points (PVT)
- 10 x 8 MAC (MAC) "Moving Average Calculation"
- Time Zones (TZone) [Forex Only]
- Volume Weighted Average Price (VWAP)
- Volume By Price (VOLBP)
- Zig Zag / Elliott Wave (ZZ)
- Indicator Windows
- Plug-Ins
- End User License Agreement(EULA)
- Gecko Software Risk Disclosure
You are here
Ichimoku Kinko Hyo (IKH)
Quick Description
Ichimoku Kinko Hyo is a purpose-built trend trading charting system that has been successfully used in nearly every tradeable market. It is unique in many ways, but its primary strength is its use of multiple data points to give the trader a deeper, more comprehensive view of price action. This deeper view, and the fact that Ichimoku is a very visual system, enables the trader to quickly discern and filter "at a glance" the low probability trading setups from those of higher probability.
History
The charting system of Ichimoku Kinko Hyo was developed by a Japanese newspaper man named Goichi Hosoda. He began developing this system before World War II with the help of numerous students that he hired to run through the optimum formulas and scenarios - analogous to how we would use computer simulated backtesting today to test a trading system. The system itself was finally released to the public in 1968, after more than twenty years of testing, when Mr. Hosoda published his book which included the final version of the system. Ichimoku Kinko Hyo has been used extensively in Asian trading rooms since Hosoda published his book and has been used successfully to trade currencies, commodities, futures, and stocks. Even with such wild popularity in Asia, Ichimoku did not make its appearance in the West until the 1990s and then, due to the utter lack of information in English on how to use it, it was mostly relegated to the category of another "exotic"
indicator by the general trading public. Only now, in the early 21st century, are western traders really beginning to understand the power of this charting system.
Equilibrium at a Glance
The name Ichimoku Kinko Hyo, which translates to "Equilibrium chart at a glance" aptly describes the system and how it is to be used, as described below:
• While Ichimoku utilizes five separate lines or components, they are not to be used individually when making trading decisions. Instead, they should be used together to form an integrated "whole" picture of price action that can be gleaned "at a glance". Thus, a simple look at an Ichimoku chart should provide the Ichimoku practitioner with a nearly immediate understanding of sentiment, momentum, and strength of the trend.
• Price action is constantly measured or gauged from the perspective of whether it is in relative equilibrium or disequilibrium. Hosoda strongly believed that the market was a direct reflection of
human group dynamics or behavior. He felt that human behavior could be described in terms of a constant cyclical movement both away from and back towards equilibrium in their lives and
interactions. Each of the five components that make up Ichimoku provide its own reflection of this equilibrium or balance.
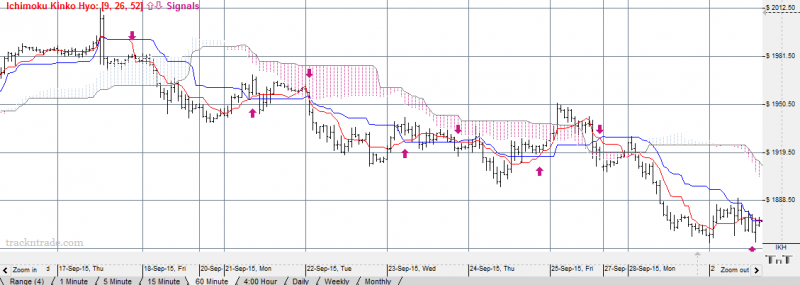
Example:
Preferences:
To open the Ichimoku Kinko Hyo Preferences click on the QuickLink (IKH) in the lower right of the chart. Or you can right-click, select Overlay Properties and then Ichimoku Kinko Hyo. If you click on the chart, the Preferences tab will go back to chart settings.
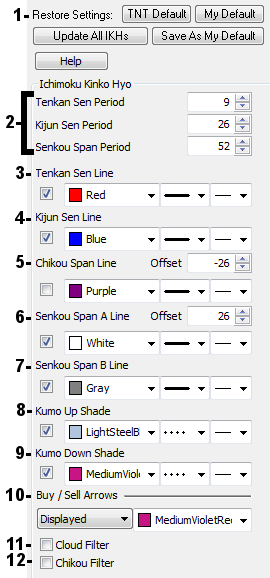
1. Restore Settings: TNT Default will change your settings back to the original software settings. My Default will change current settings to your personalized default settings. Apply To All Charts will apply your selected settings on all open charts. Save As My Default will save your current personal settings.
2. Periods: These are the periods defined for the Tenkan Sen Line, the Kijun Sen Line, and the Senkou Span Line. These are the period over which an average of the high and low are calculated.
3. Tenkan Sen Line (Conversion Line): With the default Period this is simply (9-period high + 9-period low)/2. In a daily chart, it is an average of the 9-day high and 9-day low.
4. Kijun Sen Line (Base Line): This is the same as the Tenkan Sen Line but with a 26 day period (using a daily chart and default values).
5. Chikou Span Line (Lagging Span): This is a graph of the closing price plotted at the Offset specified. On a daily chart using the default, it would draw the current close 26 days back. It should be noted that this does not include the current day's bar, as it does not have a closing price.
6. Senkou Span A Line (Leading Span A): This is the midpoint between the Tenkan Sen Line and the Kijun Sen Line plotted at the Offset specified. With the default, it would be plotted 26 days ahead.
7. Senkou Span B Line (Leading Span B): This is also like the Tenkan Sen Line but with a 52 day period (using a daily chart and default values).
8. Kumo (Cloud) Up Shade: This is the area between the Senkou Span Lines when the Senkou Span A Line is above the Senkou Span B Line. The Trend is up when prices are above the Kumo Shading area and strengthened when the Kumo Shading is an Up Shade.
9. Kumo (Cloud) Down Shade: This is the area between the Senkou Span Lines when the Senkou Span B Line is above the Senkou Span A Line. The Trend is down when prices are below the Kumo Shading area and strengthened when the Kumo Shading is a Down Shade.
10. Buy/Sell Arrows: Toggle Buy/Sell Signals to be displayed or not. Buy signals are generated if the Tenkan Sen Line Passes from below or equal to the Kijun Sen Line to above it. Sell signals are generated if the Tenkan Sen Line Passes from above or equal to the Kijun Sen Line to below it.
11. Cloud Filter: This will filter buy signals out that Tenkan Sen Line is equal or greater than then the cloud lines ( the Senkou Span A and B Lines). And then also filter out sell signals out that Tenkan Sen Line is equal or less than then the cloud lines.
12. Chikou Filter: This will filter buy signals out where the current close is greater than or equal to close from (Chikou Span Lino Offset value) periods ago. And then filter out sell signal where the current close is less than or equal to close from (Chikou Span Line Offset value) periods ago.
You can see this by turning on the Chikou Span line which is a close price bar type shifted the defined period (Offset). Then compare the Chikou Span line at the offset value defined to the close price of the market there.
So for Example: on a daily chart with Chikou Filter on, and the Chikou span line is shown with an offset of -26. If the Chikou Span line shown at 26 days ago, which is the last bar's close, is greater than the close of the bar 26 bars ago, it will not display the buy signal.