You are here
Ribbon (RBN) Chart Overlay
Ribbon Overlay Indicator
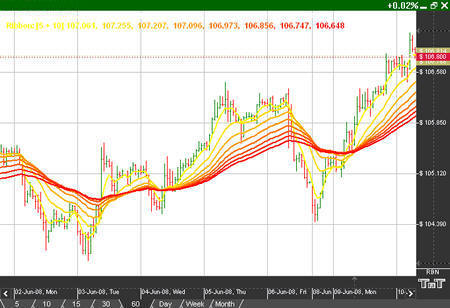
The Ribbon Overlay Indicator functions by the same principles as the Ribbon Indicator, but it is displayed as an overlay in the chart window.
Example of Ribbon Overlay
Preferences
Right-click anywhere on the chart and go to “Overlay Properties.” Select Ribbon from the list. The preferences will appear in the Control Panel. (Once you click on the chart, the Preference tab will go back to chart settings.)
 Restore Settings: TNT Default will change your settings back to the original software settings. My Default will change current settings to your personalized default settings. Apply To All Charts will apply your selected settings on all open charts. Save As My Default will save your current personal settings.
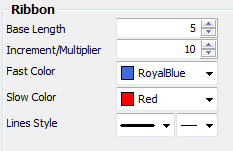
Base Length: Specify the period of the first and "fastest" moving average.
Increment/Multiplier: Specify the number by which the 7 additional moving averages periods will be incrementally calculated. This value will be added to the Base Length.
Fast Color: Specify the color of the fastest moving average line.
Slow Color: Specify the color of the slowest moving average line.
Lines Style: Choose the line style and thickness of your indicator
line.