You are here
Elliott Wave Tool
Elliott Wave Tool

To identify an Elliott Wave on a chart, select the Elliott Wave tool from your Advanced Charting toolbar. Click on the first point to place. Continue throughout the wave by clicking on each point 1-5 and ABC to place. When you get to the last point, C, the drawing is complete.
Elliott Wave Theory
The Elliott Wave theory was developed by Ralph Nelson Elliott. He suggested that the market behavior is based on waves rather than random timing. He believed that market prices rose and fell in a series of waves based on the same Golden Ratio or Golden Mean that Fibonacci proved.
Interpretation
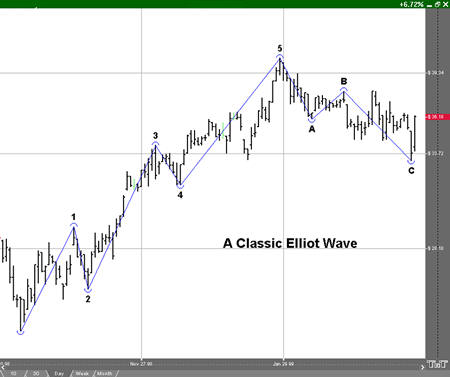
The basic idea of the Elliott Wave theory is that a market rises in a series of five "waves" (as he called them), and a market declines in a series of three declines. Elliott’s said the market rises on the first wave, declines on the second, begins to rise again on wave three, has a period of decline again on wave four, and finally completes the rise on wave five. The period of correction is referred to as a three-wave correction where the market declines for wave A, begins to rise for wave B, and falls again for wave C.
Elliott went on to further explain that a complete market cycle consisted of a 144 wave cycle, broken down into an 89 wave bull cycle, and a 55 wave bear cycle. This is based on his observation of Fibonacci’s Golden Ratio. The series of numbers Fibonacci describes shows a relationship of 1:0.618. Elliott further showed that a market usually rises or falls based on this wave cycle. Each wave in the cycle has its own characteristics.
Five Wave Advance
One: Normally very short and easy to miss.
Two: A retracement wave. Gives back all or most of what the first one gained.
Three: Usually very prominent. Follows a period of what appears as a consolidation, most people trade this wave.
Four: Noted to be very intricate, yet still a consolidation. One of Elliott’s main rules is that in a five-wave advance cycle, wave four can’t overlap wave one.
Five: Often very active. At some point declines and lead to the three wave corrective cycle.
Three Wave Decline
A: Normally seen as a minor pullback of wave five of the advance cycle.
B: Follows A of the downtrend and is often hard to spot. Should result in a third wave continuing down.
C: Usually quite significant and many traders see this as a selling opportunity. The price bars form a perfect symmetrical triangle shape.
Resizing the Elliott Wave
Select the drawing by clicking on it. You will know the drawing is selected when boxes appear at the corners. Click on a box and drag it to your desired location. Release the mouse button to place.
Moving the Elliott Wave
Select the drawing by clicking on it. Drag to the new location and release the mouse button to place.
Deleting the Elliott Wave
Select the drawing by clicking on it. Press the Del (Delete) key on your keyboard. You can also right-click the drawing and select "Delete" from the dropdown menu.
Example of an Elliott Wave
Preferences
Select the drawing by clicking on it. The properties will appear in the preferences section of your control panel.
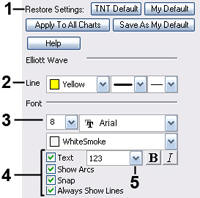 1. Restore Settings: TNT Default will change your settings back to the original software settings. My Default will change current settings to your personalized default settings. Apply To All Charts will apply your selected settings on all open charts. Save As My Default will save your current personal settings.
2. Line: From here you can choose the color, line style, and line thickness.
3. Font: Select the font, size, and color of the text. You can also choose to bold or italicize.
4. Show Text / Show Arcs/ Snap / Always Show Lines: Select the checkbox next to Text and Show Arcs to hide/show the text and arcs on the chart. Select Snap to snap the Elliot Wave Tool to price bars. Select Always Show Lines to display a line between each Elliot Wave Point
5. Points: Change how the points of the Elliot Wave are labeled from the points drop down dialog box.