You are here
Charting Preferences
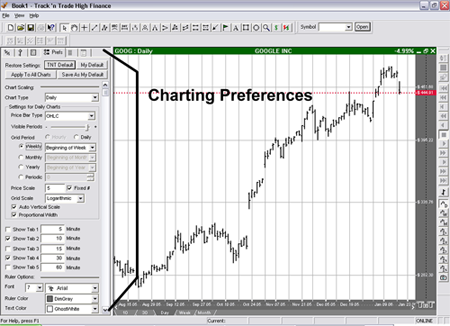
The Chart Preferences Tab is used to control how your chart looks. You can change your price bar style and color, background color, scaling, and even control time intervals. You can also choose to have different styles for each chart, or apply your favorite chart style to all your charts.
The Charting Preferences Tab is located on the Control Panel. To view the Charting Preferences Tab, right-click on the chart and select Chart Preferences, or click on the Preferences Tab in the Control Panel. The Charting Preferences Tab includes Chart Scaling, Ruler Options, Charting Colors, Price Bars, and Onscreen Indicators.
Restore Settings
TNT Default will change your settings back to the original software settings. My Default will change current settings to your personalized default settings. Apply To All Charts will apply your selected settings on all open charts. Save As My Default will save your current personal settings.
Chart Scaling
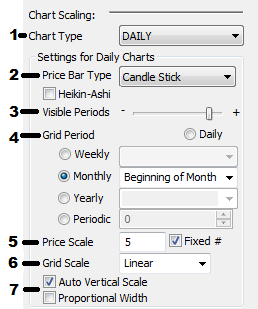 1: Chart Type: Sets the time interval each price bar will represent. You will have different grid options depending on what chart type you choose.
2: Price Bar Type: Choose what information you want your price bar to include.
- OHLC: Open, high, low, and close
- HLC: High, low, and close
- Close: Close price only
- Open: Open price only
- Candlestick: open, high, low, and close in a Japanese Candlestick style
- None: No price bars will be displayed on the chart
- Heikin-Ashi: See below*
3: Visible Periods: Scaling tool to make the chart wider or narrower to view different sections of time periods.
4: Grid Period: Sets vertical grid lines at specific intervals. For example, if you have selected a 5, 10, 15, 30, or 60 minute chart type your grid period settings will be limited to hourly, daily, or periodically. However, if you select a daily, weekly, or monthly chart type your grid period settings will be open to selecting any day of the week or month. You can also set your grid line to show daily, or at the beginning of each month, as well as selecting to show them periodically, as shown on the previous page.
5: Price Scale: Sets the amount of horizontal price grid lines you see on your chart, these are equally spaced. If you want to see price grid lines at set intervals, uncheck Fixed, then select what price increments you want your grid.
6: Grid Scale: Linear will keep your grid lines evenly distributed. Logarithmic will continually decrease the amount of space between horizontal grid lines as the price goes up.
7: Auto Vertical Scale keeps the price bars vertically centered on your chart. Proportional Width changes price bar thickness according to scale
Heikin-Ashi:
This price bar analysis method is used by traders to better identify trending markets and patterns. This technique will alter the Open/High/Low/Close of price bars viewed on the chart. The close will be determined by an average of the OHLC values as opposed to the actual market closing price for each bar. The open is determined by averaging the open and close of the previous price bar.
Heikin-Ashi may be activated from the Charting Preferences tab.
Calculation
Close = (Open+High+Low+Close)/4
Open = [Open (previous bar) + Close (previous bar)]/2
High = Max (High,Open,Close)
Low = Min (Low,Open, Close)
Ruler Options
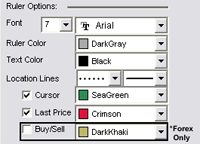 Font: Change the font and size of the text on the ruler.
Ruler/Text Color: Change the background and text color of the ruler.
Location Lines: Change the line style and thickness of your ruler lines.
Cursor, Last Price, Buy/Sell: Select if you would like to see location lines, a last price line, or buy or sell prices on your chart and what color.
Charting Colors
The Charting Colors section changes the look of your chart by allowing you to change the background color of the chart and letting you change the color of the horizontal and vertical grid lines.
Price Bars
The price bars, or tics, on your chart can be colored in two different ways. You can select Close to shade them according to their close price, or you can select Alt Days (alternating days) to shade them by odd and even days. In the Highlight section, you have the choice of highlighting the price bar you are over, or highlighting the entire day you are over.
Onscreen Indicators
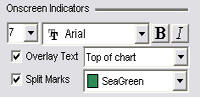 In the Onscreen Indicators section, you have the ability to change the font, size, and style of the text displayed onscreen. Click on the Overlay Text checkbox to display text for an indicator on your chart, then choose whether you would like the text to appear at the top or bottom of the chart. Also, check the Split Marks box if you would like those points displayed on the chart. Split Marks show when a market is split into two markets. Choose your desired color for the split marks as well.
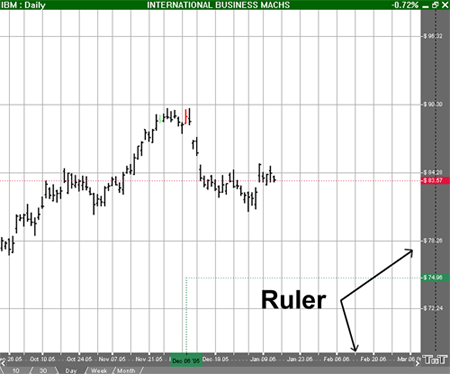
Scaling
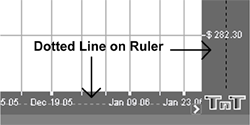 On your ruler you will see a dotted line splitting it in half. If you want to move your chart horizontally or vertically, click and drag the section of the ruler bar closest to the chart. To scale your chart horizontally or vertically, click and drag the section of the ruler bar farthest from the chart.
Margin Arrows
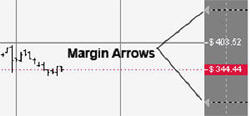 On the Ruler Bar you will notice four Margin Arrows, two on the right ruler, and two on the bottom ruler. These arrows are used to center your chart within these "margins." To move the margin click on the arrow, continue holding down the mouse button, and drag to the new location. Then click on the center chart button to resize the chart.
Chart Right-Click Menu
The right-click menu is a shortcut to customize your chart, add overlay indicators, add indicator windows below your chart, and change other features. Make sure your pointer is selected on your navigation menu, then select the chart and right-click. The following menu will appear.
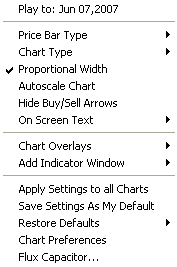 Play to: Date: Your cursor should be in line horizontally with the date you want the chart to play to. Select this option and the chart will either erase price bars to the date or play price bars up to the date you have selected. Choose what Price Bar Type you would like to view.
Chart Type will change the time intervals.
Proportional Width will make your price bar width proportional to the scale of your chart. Autoscale Chart will center your price bars within the height of your chart. Hide Buy/Sell Arrows will show or hide your arrows for the indicator selected. Choose to show your On Screen Text and where you want it to appear.
Select which Chart Overlays you would like to appear on the chart. Or if you would like to Add Indicator Window at the bottom of your chart window.
Apply Settings to all Charts will apply your selected settings on all open charts. Save Settings As My Default will save your current personal settings. Restore Defaults will change your settings back to the original software settings or to your personal saved settings.
Chart Preferences: Select to display the Chart Preferences Tab to the left of your chart.