You are here
Ribbon Indicator
The Ribbon Indicator is a series of exponential moving averages lines used to identify trends. By placing 8 moving averages calculated with differing time periods onto the same chart, we can see the relative strength of a market trend. The indicator is very useful in highlighting and confirming trend changes with the Bulls 'n Bears Trading System.
Convergence and Divergence
The most important signals are taken from the spacing between the Ribbon lines in each group, not from crossovers. When shorter-term lines (yellow) and longer-term lines (red) within a group are parallel and close together, the group are largely in agreement. When the Ribbon lines widen apart, this signals divergent views within the group. When Ribbon lines converge, this is a sign that the group view is changing.
Trend Strength
Parallel long-term Ribbon lines signal long-term investor support and a strong trend; and short-term Ribbon lines tend to bounce off the long-term Ribbon lines group.
Trend Weakness: Both groups of Ribbon lines converge and fluctuate more than usual.
Trend Start: A change in price direction accompanied by expanding Ribbon lines in both groups.
Short-Term Reversals: The short-term group crossover, diverge and then again converge; while the long-term group remain parallel.
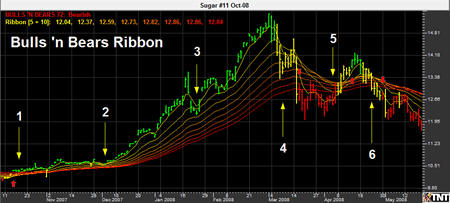
1. Short-term retracement gives a long entry signal
2. Another short-term retracement
3. Moving averages diverge, increasing the risk of a reversal
4. Strong retracement indicated changing short and medium-term views, but long-term view holds firm
5. Short-term retracement signals recovery
6. Moving averages diverge, warning of another reversal
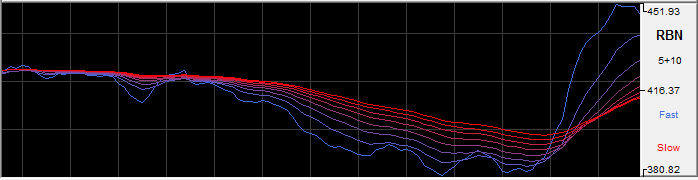
The Ribbon Indicator is unique in Track 'n Trade because it can be viewed both in the indicator window or as a chart overlay.
Example of Ribbon in Indicator Window
Preferences
Open the Preferences Tab in your Control Panel. Select the RBN quick link at the right of the indicator window. (Once you click on the chart, the Preference tab will go back to chart settings.)
Restore Settings: TNT Default will change your settings back to the original software settings. My Default will change current settings to your personalized default settings. Apply To All Charts will apply your selected settings on all open charts. Save As My Default will save your current personal settings.
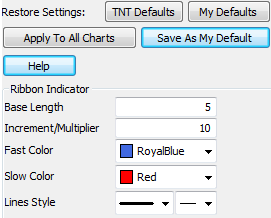
Base Length: Specify the period of the first and "fastest" moving average.
Increment/Multiplier: Specify the number by which the 7 additional moving averages periods will be incrementally calculated. This value will be added to the Base Length.
Fast Color: Specify the color of the fastest moving average line.
Slow Color: Specify the color of the slowest moving average line.
Lines Style: Choose the line style and thickness of your indicator line.