You are here
Overlay Indicators in the Chart Window
To display an Overlay Indicator, right-click the Chart Window and select Chart Overlays. Select the name of the Overlay Indicator that you would like to view from the dropdown menu. A checkmark will appear next to any indicators you have selected and all selected indicators will show directly on your chart, not in the indicator window. To remove an overlay indicator from your chart, click on the indicator in the dropdown menu again and the checkmark with disappear.
Right-Click Menu
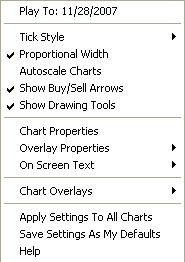
Tick Style, Proportional Width, Autoscale Charts, and Show Buy/Sell Arrows are explained in the Chartbooks section of the Getting Started chapter.
If you select Chart Properties, the chart preferences will open in the Control Panel. You can use this to change how your chart, price bars, and rulers look. (See the Charting Preferences section of the Getting Started chapter.)
To view the preferences for one of your indicators, right-click the Chart Window and select Overlay Properties. Any overlay indicators you have displayed will appear in the menu to the side. Select the indicator you would like to modify, and the preferences will open in the Control Panel.
The Overlay Properties option will only appear in your right-click menu if you have an overlay indicator displayed.
Highlight On Screen Text and select if you would like to view indicator values on the chart window and where you would like them to be located on your chart.
Use Chart Overlays to display or remove individual Overlay Indicators.
The Apply Settings To All Charts and Save Settings As My Defaults options work just like the similar buttons in the Preferences section of your control panel. Apply Settings To All Charts will apply your selected settings on all open charts. Save Settings As My Defaults will save your current personal settings.