You are here
GTR - Gator Oscillator
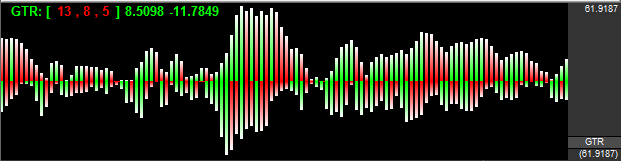
The Gator was created on a relative scale; what seems to be a large move in the market today may well be just a small move on the historical scale, since the Gator graphically represents itself only against its own historical price line. As the market trends, the Gator will also trend, causing historical representations of market momentum and movement to pale in comparison.
Example of Gator Oscillator
Preferences
Open the Preferences Tab in your Control Panel. Select the GTR quick link at the right of the indicator window. (Once you click on the chart, the Preference tab will go back to chart settings.)
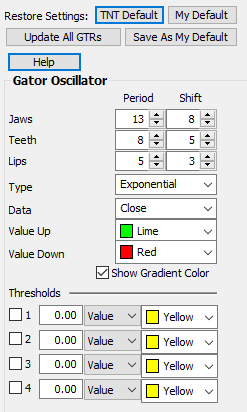 Restore Settings: TNT Default will change your settings back to the original software settings. My Default will change current settings to your personalized default settings. Apply To All Charts will apply your selected settings on all open charts. Save As My Default will save your current personal settings.
Jaws, Teeth, Lips: Specify your periods and shift specifications.
Type: Select Simple, Linear Weight, or Exponential.
Data: Choose the data you would like to be calculated.
Value Up: Select the color of the histogram when the value is up.
Value Down: Select the color of the histogram when the value is down.
Show Gradient Color: Toggle gradient color shading on or off.
Thresholds: Gives you the option of displaying four threshold lines, which can be displayed as a value or a percentage in the Indicator Window. You also have the option to change the color of the threshold line.