You are here
CMF - Chaikin Money Flow
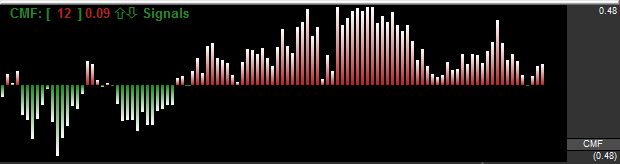
By comparing the close to the high and low, the CMF is determining if the market has pressure to sell or buy. In doing this, the CMF is giving an indication of overbought and oversold by using these comparisons. If the market is consistently closing in the top region of the price bar and there is an increase in volume (showing an increase in the number of trades) then CMF exhibits a positive value. If the market is consistently closing in the bottom region of the price bar and there’s an increase in volume, CMF exhibits a negative value.
When the CMF indicator crosses the zero line either up or down, this is an indication of a change in trend. Traders use this indicator to help confirm breakout signals from either support or resistance trend lines.
Calculation
The calculation of the CMF is here:
CMF = SUM(MFM, n) / SUM(VOL, n)
where n = Period
MFM = VOL x [(close - low) - (high - close)] / (high - low)
MFM stands for Money Flow Multiplier
Buy/Sell Signals
A buy signal occurs when the CMF value crosses from below the 0 line to above the 0 line. A sell signal occurs when the CMF value crosses from above the 0 line to below the 0 line.
Example of Chaikin Money Flow
Preferences
Right-click on the CMF button in your Indicator toolbar and select CMF Settings. The Preferences Tab will open in the Control Panel and the CMF preferences will be displayed. (Once you click on the chart, the Preference tab will go back to chart settings.)
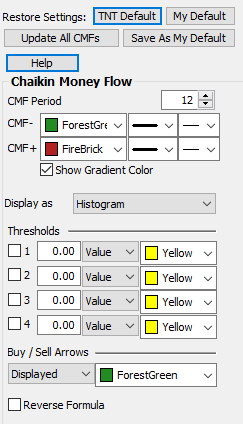 Restore Settings: TNT Default will change your settings back to the original software settings. My Default will change current settings to your personalized default settings. Apply To All Charts will apply your selected settings on all open charts. Save As My Default will save your current personal settings.
CMF Period: Specify the number of days to be used in calculating the CMF.
CMF-: Change the color, style, and thickness of your line.
CMF+: Change the color, style, and thickness of your line.
Show Gradient Color: Toggle gradient color shading on or off.
Display as: Choose between displaying CMF as a histogram or a line.
Thresholds: Gives you the option of displaying four threshold lines, which can be displayed as a value or a percentage in the Indicator Window. You also have the option to change the color of the threshold line.
Buy/Sell Arrows: Turns the display for buy/sell arrows on and off. You also have the option to change the color of the buy/sell arrows.