- Getting Started
- Control Panel
- Toolbars
- Chart Overlay Indicators
- Indicator Windows
- COT - Commitment of Traders
- PROB - Market Probability
- RBN - Ribbon
- SEAS - Seasonal Trend
- AD - Williams Accum/Dist "Williams Accumulation/Distribution"
- ATR - Average True Range
- %B - Percent Bollinger Bands
- BW - Bollinger Bandwidth
- CCI - Commodity Channel Index
- CMF - Chaikin Money Flow
- DMI - Directional Movement Index
- FSTO - Fast Stochastics
- GTR - Gator Oscillator
- HVOL - Historic Volatility
- KST - Know Sure Thing
- MACD - Moving Average Convergence/Divergence
- MFI - Money Flow Index
- MOM - Momentum
- OBV - On Balance Volume
- PPO - % Price Oscillator
- PVO - % Volume Oscillator
- %R - Williams' %R "Williams Percent R"
- ROC - Rate of Change
- RSI - Relative Strength Index
- SRSI - Stochastic Relative Strength Index
- SSTO - Slow Stochastics
- TRIX - Triple Exponential Average
- ULT - Ultimate Oscillator
- VOL - Volume
- Plug-Ins
- End User License Agreement(EULA)
- Gecko Software Risk Disclosure
You are here
FSTO - Fast Stochastics
The Stochastic Process was invented by Dr. George C. Lane under the basic premise that during periods of decrease, daily closes tend to accumulate near the extreme low of the day and, conversely, during periods of increase, daily closes tend to accumulate near the extreme highs of the day.
This indicator is designed to show conditions of overbought and oversold markets. Stochastics are divided into two types: Regular Stochastics, often referred to as Fast Stochastics, and Slow Stochastics. Fast Stochastics are more sensitive to price changes and can give a lot in the short-term, hence the need for Slow Stochastics.
Stochastics display two lines that move in a vertical scale between 0 and 100, representing percentiles from 0% to 100%. Think of the level of Stochastics as where the most current close is within a specific range. If Stochastics are reading 50%, the current close is in the middle of the price range for a specified period of time. If Stochastics are reading 100%, the close is at the high of the range, and 0% represents the current close price being at the low of the range. This will help you to understand why Stochastics are a counter-trend indicator, in that the underlying principle behind Stochastics is that prices will move back to the center of the trading range, or the opposite extreme.
When both lines move to an area below 20 on this scale they are said to be in an oversold zone. Conversely, when both %K and %D move to above 80 on this same scale they are indicating an overbought zone. It is this indication of market sentiment that makes this counter-trend indicator useful.
George Lane emphasized that the most important signal generated by this method was the difference or divergence between %D and the underlying market price. He said that the divergence is where %D line makes a group of lower highs while the market makes a series of higher highs. This would indicate an overbought condition. The reverse would be true of an oversold market, with %D making higher lows and prices making lower lows.
As with a dual moving average system, when the faster-reacting indicator crosses the slower moving indicator, a buy or sell is signaled. Because Stochastics give an indication of either overbought or oversold, you would first want to see both lines in the above 80 or below 20 range, and sloping out of that range back to the middle before looking for these trade triggers.
Calculation
The first step in computing the stochastic indicator is to determine the n period high and low. Suppose you specified twenty periods for the stochastic. Determine the highest high and lowest low during the last twenty trading intervals. It determines the trading range for that time period. The trading range changes on a continuous basis. The calculations for the %K is here:
%Kt = ( (Closet - Lown) / (Highn - Lown) ) x 100
%Kt: The value for the first %K for the current time period.
Closet: The closing price for the current period.
Lown: The lowest low during the n periods.
Highn: The highest high during the n time periods.
n: The value you specify.
Once you obtain the %K value, you start computing the %D value which is an accumulative moving average. Since the %D is a moving average of a moving average, it requires several trading intervals before the values are calculated properly. If you specify a 20 period stochastic, the software system requires 26 trading intervals before it can calculate valid %K and %D values. The formula for the %D is here:
%DT = ( (%DT-1 x 2) + %Kt) / 3
%DT: The value for %D in the current period.
%DT-1: The value for %D in the previous period.
%Kt: The value for %K in the current period.
The values 2 and 3 are constants. You specify the constants and the length of the time period to examine for the trading range.
Buy/Sell Signals
A buy signal occurs when both lines are below the lower threshold and the %K line crosses from below the %D line to above the %D line. A sell signal occurs when both lines are above the upper threshold and the %K line crosses from above the %D line to below the %D line.
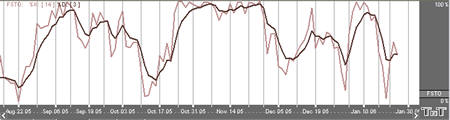
Example of Fast Stochastics
Preferences
Open the Preferences Tab in your Control Panel. Select the FSTO quick link at the right of the indicator window. (Once you click on the chart, the Preference tab will go back to chart settings.)
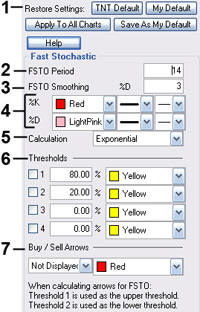 1. Restore Settings: TNT Default will change your settings back to the original software settings. My Default will change current settings to your personalized default settings. Apply To All Charts will apply your selected settings on all open charts. Save As My Default will save your current personal settings.
2. FSTO Period: To specify the number of days used in calculating the Fast Stochastics indicator, click in the box, highlight the number, and type in a new value.
3. FSTO Smoothing: To specify the number of days used in calculating smoothing, click in the box, highlight the number, then type in a new value.
4. %K/%D: Change the color, line style and line thickness of the %K and %D lines.
5. Calculation: Choose from Exponential, Simple, and Wilder’s Smoothing for the type of formula used to calculate the indicator.
6. Thresholds: You are given the option to view four threshold lines in the Indicator Window. The crossing of the %D line above the %K line is a sell signal and only confirmed if this crossing occurred above the Upper Threshold line. The crossing of the %D line below the %K line is a buy signal and only confirmed if this crossing occurred below the Lower Threshold line. You can also change the color of the threshold lines.
7. Buy/Sell Arrows: Select to display the buy/sell arrows. Click the arrow to view Displayed or Not Displayed. You also have the option to change the color of the buy/sell arrows.