- Getting Started
- Control Panel
- Toolbars
- Chart Overlay Indicators
- Indicator Windows
- Plug-Ins
- End User License Agreement(EULA)
- Gecko Software Risk Disclosure
You are here
Preferences Tab
The Preferences Tab is used to display the settings of the currently selected feature of the software. Once the Preferences Tab has been opened, left-clicking on any chart, tool, or indicator will immediately show the preferences for the selected item.
Chart Preferences
When you click on the chart with the Preferences Tab open, the Chart Preferences will appear. You can also right-click on the chart and select Chart Preferences. This is used to control how your chart looks. You can change your price bar style and color, background color, scaling, and even control time intervals. You can also choose to have different styles for each chart or apply your favorite chart style to all your charts.
Restore Settings: TNT Default will change your settings back to the original software settings. My Default will change current settings to your personalized default settings. Apply To All Charts will apply your selected settings on all open charts. Save As My Default will save your current settings to your personalized default settings.
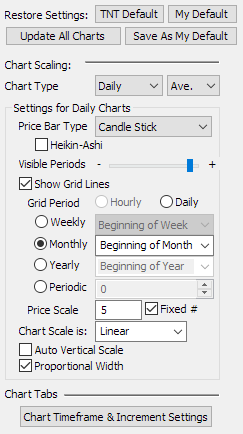
Chart Scaling
Chart Type: Sets the time interval each price bar will represent. You will have different grid options depending on what chart type you choose.
*Forex only: Drop-down menu next to the Chart Type to set the price bar according to the bid/ask.
Sell - bid
Buy - ask
Ave. - the average of the bid/ask
B & S - High of the ask and Low of the bid with the average Open and Close
Price Bar Type: Choose what information you want your price bar to include.
-OHLC: Open, high, low, and close.
-HLC: High, low, and close.
-Close: Close price only. Plotted as a line.
-Open: Open price only. Plotted as a line.
-Candlestick: open, high, low, and close in a -Japanese Candlestick style
-None: No price bars will be displayed on the chart
Heikin-Ashi: See here.
Visible Periods: Scaling tool to show more or less bars in one window
Grid Period: Sets vertical grid lines at specific intervals. For example, if you have selected a 5, 10, 15, 30, or 60-minute chart type your grid period settings will be limited to hourly, daily, or periodic.
However, if you select a daily, weekly, or monthly chart type your grid period settings will be open to select any day of the week or month. You can also set your grid line to show daily, or at the beginning of each month, as well as select to show them periodic.
Price Scale: Sets the amount of horizontal price grid lines you see on your chart, these are equally spaced. If you want to see price grid lines at set intervals, uncheck Fixed, then select what price increments you want your grid.
Chart Scale: Linear will keep your grid lines evenly distributed. Logarithmic will continually decrease the amount of space between horizontal grid lines as the price goes up.
Auto Vertical Scale keeps the price bars vertically centered on your chart.
Proportional Width: changes price bar thickness according to scale
Chart Tabs
Chart Timeframe & Increment Settings: This button takes you to the Setup Chart Tabs Dialog. You can set up custom time frames and different charts tab to be shown in the bottom left of the chart. You can also get to this dialog by right clicking on one of the chart tabs in the bottom left
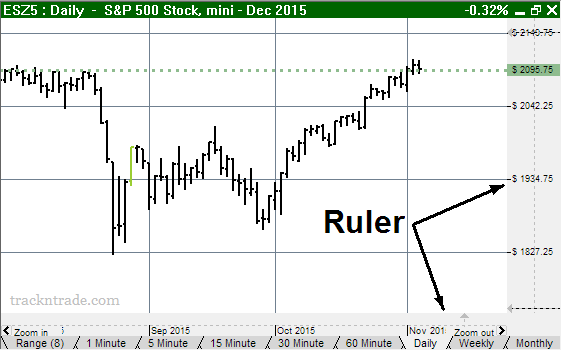
Ruler Options
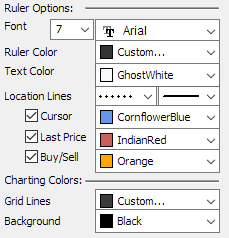
Font: Change the font and size of the text on the ruler.
Ruler/Text Color: Change the background and text color of the ruler.
Location Lines: Change the line style and thickness of your ruler lines.
Cursor, Last Price, Buy/Sell: Select if you would like to see cursor location lines, the last price line, or buy and sell price lines on your chart, and what color you would like them to be.
Charting Colors
Grid Lines: Change the color of the horizontal and vertical grid lines.
Background: Change the chart background color.
Price Bars
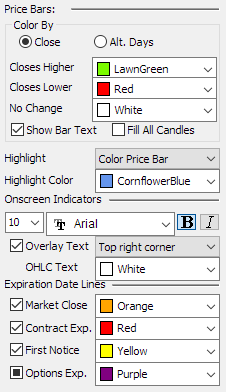 Color By: The price bars on your chart can be colored in two different ways
Close: shade them according to the close compared to the previous close price.
Alt Days: (alternating days) shade them by odd and even days.
Highlight: Choose between highlighting the price bar you are over or highlighting the entire day (bar) you are over. Hold down shift to quickly switch to the other option while your mouse is over the chart.
Onscreen Indicators
Change the font, size, and style of the text displayed onscreen for the overlays, indicators, and OHLC text.
Overlay Text: Select to display text for overlays, indicator, and OHLC on your chart. Then choose where you want this text to be displayed
OHLC Text: Choose the color for the OHLC text.
Expiration Date Lines: [Futures Only] Choose the color of the Market Close, Contract Expiration, First Notice, and Options Expiration timelines. Putting a check in the Options Expirations will show all options expiration times for that chart contract.
Total Net Position Line: [Forex Only] Choose the Color of the Total Net Position Line. This can be toggled on or off at View in the top left, then check on or off Show Total Net Position Line