
Toolbars are by default located at the top of the software above your charts but below the menus. These include many important tools and shortcuts to other functions.
Moving Toolbars: The toolbars can be moved around to the user's preference. The 4 dots on the left edge of the toolbar is where the user will click and drag the tool bar to the user's desired location. They can be placed in the top of the software (by default), at the bottom of the software, on the far left and right of the software to make a vertical toolbar, or a floating window anywhere else. When the toolbar is a floating window, move it by clicking and draging the title.

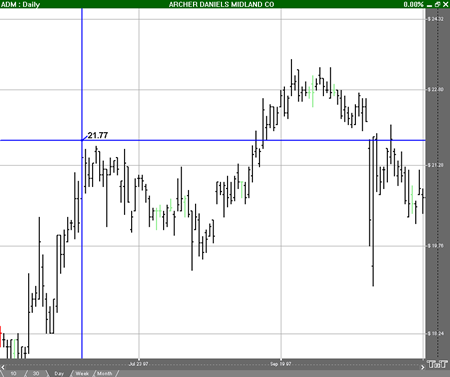
The first tool in the Charting toolbar is the Crosshair tool. This tool is helpful when lining up your technical indicators and recurring price patterns. Click the Crosshair button and position the crosshair on your chart and click your mouse. The crosshair draws a line vertically and horizontally on the chart. To help place the crosshair line on a specific value, the cursor price is displayed on the horizontal line of the crosshair, and the date/time is shown on the vertical line.
To select the drawing, click on the center point of the crosshair and drag to the new location. Release your mouse button to place. The tool is selected when a box appears at the center point.
There are two ways to delete the Crosshair tool. If your crosshair is selected (you’ve clicked on it and the box appears at the center point), you can press the Del (Delete) key on your keyboard. You can also place your mouse cursor over the crosshair and right-click. In the drop-down menu, select “Delete.”
If you only want to delete the horizontal or vertical line of the crosshair, select the crosshair by clicking on it and view the preferences in the control panel. Select or deselect “Show Horizontal (Vertical) Line.” A check will appear in front of the item when it is selected.
Select the crosshair by clicking on it. The properties will appear in the preferences section of your control panel. Or you can right click on a drawn crosshair tool and select Properties.
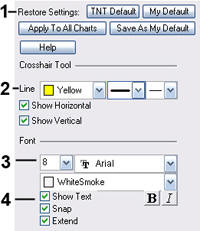
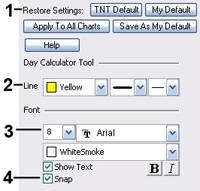
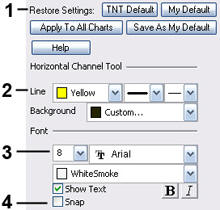
1. Restore Settings: TNT Default will change your settings back to the original software settings. My Default will change current settings to your personalized default settings. Apply To All Charts will apply your selected settings on all open charts. Save As My Default will save your current personal settings.
2. Line: You can choose the color, line style, and line thickness of your crosshair. Deselect Show Horizontal Line or Show Vertical Line to hide your lines.
3. Text: Select the font, size, and color of the text. You can also choose to bold or italicize your text. Select the checkbox next to Show Text to hide or show your text on the chart.
4. Snap: Allows the vertical line to snap to price bars when moved.
Extend: Extends your vertical line into all indicator windows you have open.

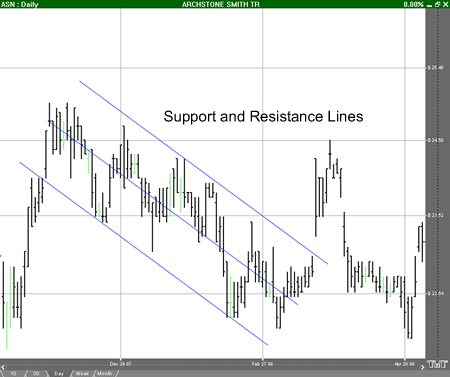
To draw a support or resistance line, also referred to as a trend, use the Line tool. Select the Line tool from your Charting toolbar. Click on your chart where you want the line to begin. Hold down the mouse button and move to the position you want your line to end. Release mouse button to place.
Support and Resistance - Technical Analysis
Markets have a tendency to move in troughs and peaks or, more appropriately, "Support and Resistance."
Support
These Troughs are called support, indicating that support is level. This shows that buying interest is strong enough to overcome selling pressure. A decrease in price is reversed and prices rise once again. Typically, a support level is identified by a previous set of lows.
Resistance
Resistance is essentially the opposite of support. Resistance is defined as a horizontal ceiling where the pressure to sell is greater than the pressure to buy. An increase in price is reversed and prices revert downward. Typically, support can be located on a chart by a previous set of highs.
Select the line drawing by clicking on it. The line is selected when boxes appear at the ends of the line. Click on one of the boxes and drag it to the desired length. Release the mouse button to place the end point of the line.
Select the line drawing by clicking on it. Click on the line, not an end box, and drag the line to the new location. Release the mouse button to place.
Select the line drawing by clicking on it. Press the Del (Delete) key on your keyboard. You can also right-click the line drawing and select “Delete” from the dropdown menu.
Select the line drawing by clicking on it. The properties will appear in the preferences section of your control panel. Or you can right click on a drawn line tool and select Properties.
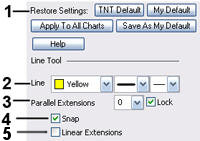
1. Restore Settings: TNT Default will change your settings back to the original software settings. My Default will change current settings to your personalized default settings. Apply To All Charts will apply your selected settings on all open charts. Save As My Default will save your current personal settings.
2. Line: From here you can choose the color, line style, and line thickness.
3. Parallel Extensions: To add parallel lines above and below the line you drew, select from the drop-down menu how many lines you would like to add. Select the checkbox by Lock to have equal space between the lines, and unselect the box if you would like to move them independently.
4. Snap: Allows the line to snap to price bars when moved.
5. Linear Extensions: Extends the line tool to the end of the graph.

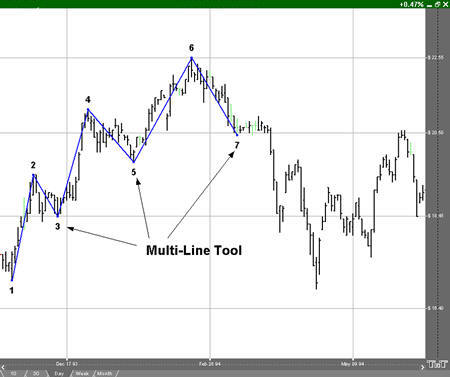
Some contracts will have a continuous line, or trend, of alternating support and resistance. To illustrate these multi-lines, select the Multi-Line tool from your Charting toolbar. Click on the chart where you want your line to start. Move your mouse to the next point on your multi-line and click to place. Repeat this until the last point. When placing the last point on the multi-line, right-click to finish.
Select the multi-line drawing by clicking on it. You will know the multi-line is selected when boxes appear at the ends of the multi-line. Click on a box and drag it to your desired length. Release the mouse button to place.
Select the multi-line drawing by clicking on it. Click on the multi-line, not a box, and drag it to the new location. Release mouse button to place.
Select the multi-line drawing by clicking on it. Press the Del (Delete) key on your keyboard. You can also right-click the multi-line drawing and select “Delete” from the dropdown menu.
Select the line drawing by clicking on it. The properties will appear in the preferences section of your control panel. Or you can right click on a drawn muli line tool and select Properties.
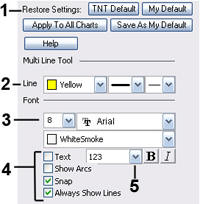
1. Restore Settings: TNT Default will change your settings back to the original software settings. My Default will change current settings to your personalized default settings. Apply To All Charts will apply your selected settings on all open charts. Save As My Default will save your current personal settings.
2. Line: From here you can choose the color, line style, and line thickness.
3. Text: Select the font, size, and color of the text. You can also choose to see numbers or letters. Select Text to hide or show your text on the chart. Select from options in the drop down dialog box to determine how you prefer to display the labeling of each point of the Multi-Line Tool.
4. Show Arcs: Select to hide/show arcs on points of the multi-line. Snap: Allow the line to snap to price bars when moved. Always Show Lines: Select to keep lines on chart even when the multi-line is unselected.

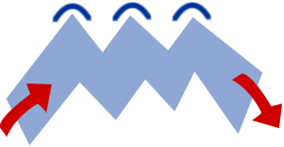
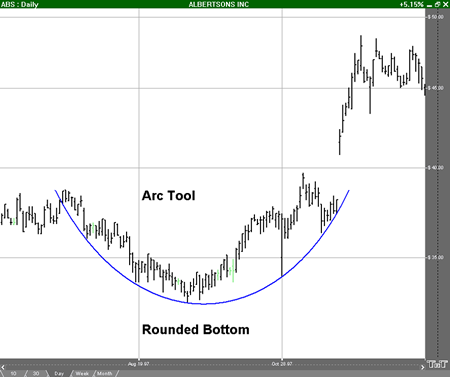
To illustrate a Rounded top or bottom formation on your futures chart, select the Arc tool in your Advanced Charting toolbar. Move the mouse pointer to the point on the chart that will be the corner of your arc. Hold the mouse button and drag to your end point. Release the mouse button to place.
The Rounded Top & Bottom formation is a very gradual change in trend.
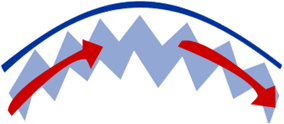 Rounded Top
The Rounded Top formation consists of a gradual change in trend from up to down.
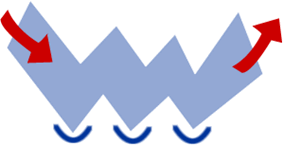
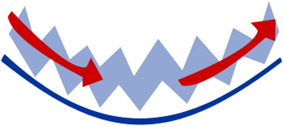 Rounded Bottom
The Rounded Bottom formation consists of a gradual change in trend from down to up. This formation is the exact opposite of a Rounded Top Formation.
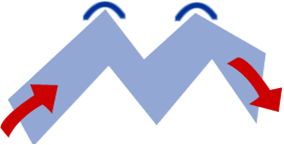 Double Top
This formation includes two distinct "tops" and anticipates a change in trend from up to down.
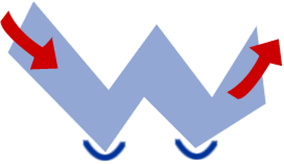 Double Bottom
This formation includes two distinct "bottoms" and anticipates a change in trend from down to up. This formation is the exact opposite of a Double Top.
 Triple Top
This formation includes three distinct "tops" and anticipates a change in trend from up to down.
 Triple Bottom
This formation includes three distinct "bottoms" and anticipates a change in trend from down to up. This formation is the exact opposite of a Triple Top.
Select the drawing by clicking on it. You will know the drawing is selected when boxes appear at the corners. Click on a box and drag it to your desired location. Release the mouse button to place.
Select the drawing by clicking on it. Drag to the new location and release the mouse button to place.
Select the drawing by clicking on it. Press the Del (Delete) key on your keyboard. You can also right-click the drawing and select “Delete” from the dropdown menu.
Select the drawing by clicking on it. The properties will appear in the preferences section of your control panel. Or you can right click on a drawn arc tool and select Properties.
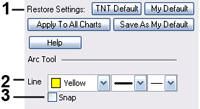
1. Restore Settings: TNT Default will change your settings back to the original software settings. My Default will change current settings to your personalized default settings. Apply To All Charts will apply your selected settings on all open charts. Save As My Default will save your current personal settings.
2. Line: From here you can choose the color, line style, and line thickness.
3. Snap: Check to have arcs drawn to snap to price bars when moved.

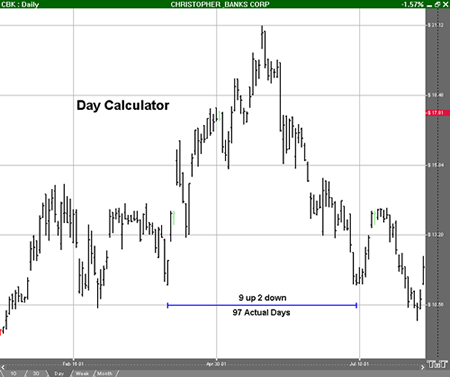
The Bar Calculator Tool enables you to measure the number of trading days versus actual days that are between two points on the chart. Also calculated on this tool is the number of days that the market closed high or lower in comparison with the previous day. Select the Bar Calculator Tool from your Advanced Charting toolbar. Click where you would like to start and drag the horizontal line to where you would like it to end. Release the mouse button to place.
In the futures industry trading, days are scheduled around holidays and weekends. When looking at a futures chart, it is difficult to determine how many actual days have passed while working a trade.
The number of trading days is also significant for traders using the number of trading days as a rule in conjunction with a formation. For example with the 123 Top or Bottom formation, many traders use the 10-20-50 rule. This rule defines a 123 if there are 10 trading days between the #1 and #2, and 10 days between the #2 and #3 points.
To calculate the actual(Calendar) days on a chart, use the Bar Calculator Tool.
Another statistic used alongside formations and other theories is the day higher and lower calculation. This calculation determines how many days, in a defined set of price bars, were "higher" or "lower." A day is considered a "Higher Day" if the close is higher than any previous close in the set of price bars selected. Conversely, a day is considered a "Lower Day" if the close is lower than any previous trading day in the defined set of price bars.
Select the drawing by clicking on it. You will know the drawing is selected when boxes appear at the corners. Click on a box and drag it to your desired location. Release the mouse button to place.
Select the drawing by clicking on it. Drag to the new location and release the mouse button to place.
Select the drawing by clicking on it. Press the Del (Delete) key on your keyboard. You can also right-click the drawing and select “Delete” from the dropdown menu.
Select the drawing by clicking on it. The properties will appear in the preferences section of your control panel. Or you can right click on a drawn bar calculator tool and select Properties.
1. Restore Settings: TNT Default will change your settings back to the original software settings. My Default will change current settings to your personalized default settings. Apply To All Charts will apply your selected settings on all open charts. Save As My Default will save your current personal settings.
2. Line: From here you can choose the color, line style, and line thickness.
3. Font: Select the font, size, and color of the text. Select Show Text to hide or show your text on the chart.
4. Show Text / Snap: Select the checkbox next to Show Text to hide/show your text on the chart. Check Snap to have the Bar Calculator to snap to price bars when moved.

Use the 123 tool to chart both top and bottom formations. To draw a 123 formation, select the 123 tool from your Charting toolbar. Position the mouse pointer over the spot you would like to place the 1 point and click to place. Move to the 2 point and click to place. Move to the 3 point and click to place.
The 123 formation anticipates a change in trend. There are both top and bottom formations.
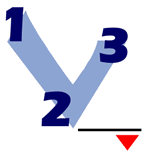 123 Top Formation
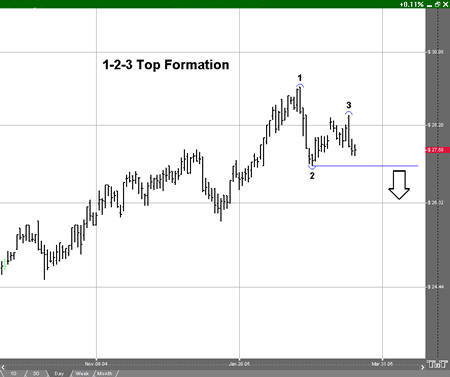
The 123 top formation anticipates a change in trend, from up to down, on a break below the number two point. This formation is easily identified because the number 1 point is the annual price high for the contract.
To trade a 123 top formation, place a sell order on a break down past the 2 point. Then place a stop loss order just above the 1 point (an industry standard) or just above the 3 point (a more conservative stop loss placement).
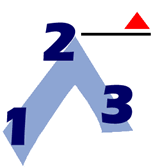 123 Bottom Formation
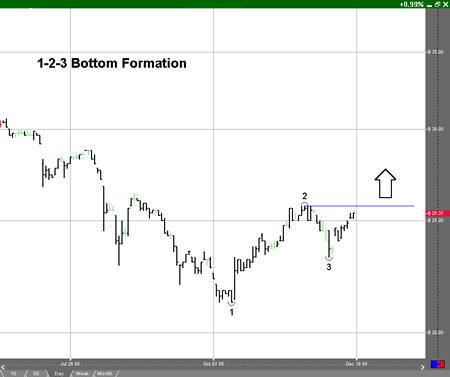
The 123 bottom formation anticipates a change in trend from down to up on a break above the number 2 point. A 123 bottom formation is easily identified because the number 1 point is the annual price low.
To trade a 123 bottom formation, place a buy order just above the 2 point. Then place a stop loss order just below the 1 point (an industry standard) or just below the 3 point (a more conservative placement).
Select the 123 drawing by clicking on it. You will know the 123 drawing is selected when boxes appear on the corners. Click on a box and drag it to your desired length. Release the mouse button to place.
Select the 123 drawing by clicking on it. The drawing is selected when boxes appear at the 1, 2, and 3 end points. Drag to the new location and release the mouse button to place.
Select the 123 drawing by clicking on it. Press the Del (Delete) key on your keyboard. You can also right-click the 123 drawing and select “Delete” from the drop-down menu.
Select the 123 tool by clicking on it. The properties will show up in the preferences section of your control panel. Or you can right click on a drawn 123 tool and select Properties.
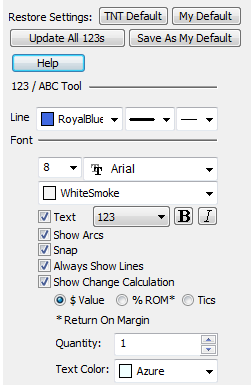
Restore Settings: TNT Default will change your settings back to the original software settings. My Default will change current settings to your personalized default settings. Apply To All Charts will apply your selected settings on all open charts. Save As My Default will save your current personal settings.
Line: From here you can choose the color, line style, and line thickness.
Font: Select the font, size, and color of the text. You can also choose to see numbers or letters. Select Text to hide or show your text on the chart.
Line Label (123): Select from different options how to label your 123 lines.
Text / Show Arcs / Snap / Always Show Lines: Select these options to display the 1-2-3 tool the way that you prefer. You can choose to hide or show Text, Arcs, Prediction, and line You can also choose whether you would like the 1-2-3 Tool to snap to price bars.
Show Change Calculation: Select to display the dollar value, percent return on margin or tics/pips value between price points 1-2 and 2-3.
Quantity: Determines the trading quantity used to calculate the $ Value, %ROM and Tics/Pips value for Change Calculation.
Text Color: Choose the color of your Change Calculation text.
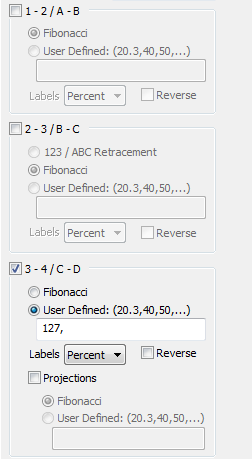 1 - 2 / A - B: Check to label distances between points 1-2.
Fibonacci: Will label Fibonacci percentage distances between points 1-2.
User Defined: Select to enter custom percentage distance markers.
Labels: Choose how you would like these values displayed within your chart. None will remove text descriptions, leaving only the line markers. Price will dispay the market price for each percentage value. Both will display both percent and market price. Reverse changes the labeling from ascending to descending.
2 - 3 / B - C: Activate to label percentage points on line 2-3.
123 / ABC Retracement: Activate to display the percent that line 2-3 retraced back through line 1-2.
3 - 4 / C - D: Creates the 123 projection line, with a 127% distance label by default. Check Fibonacci to display the default Fibonacci distance labels.
Projections: Activate to extend the 3-4 line beyond the default 127% distance.

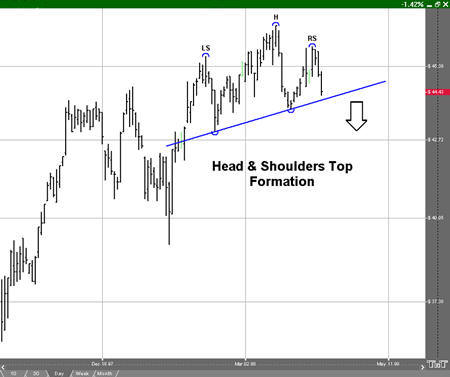
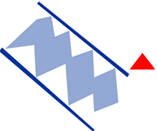
To identify a H&S top or bottom formation, use the Head & Shoulder tool. Select the Head & Shoulders tool from your Charting toolbar. Position the mouse pointer where you would like to place the Left Shoulder (LS) point and click to place. Move to the valley point between the LS and the Head (H) and click to place. Move to the H point and click to place. Move to the valley point between the H and Right Shoulder (RS) and click to place. Move to the RS point and click to place.
This formation can appear anywhere in the chart and is made up of the Head, Left Shoulder, and Right Shoulder. There are both top and bottom formations.
 Head & Shoulders Top Formation
In this formation, the middle peak, the Head (H), is higher than either shoulder (LS, RS). This formation anticipates a drop in price below the Neckline (shown by the red arrow).
To trade a Head & Shoulders top formation, place a sell order on the break of the Neckline. Your stop loss order should then be placed just above the Head. The stop loss order can also be placed above the Right Shoulder as a more conservative point.
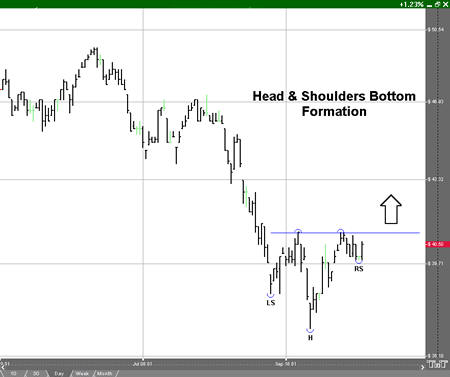
 Head & Shoulders Bottom Formation
This formation is an inverted version of the Head & Shoulders top formation. A Head & Shoulders bottom anticipates a rise in price above the Neckline.
To trade a Head & Shoulders bottom formation, place a buy order on the break up from the Neckline. Then place a stop loss order just below the Head. The stop loss order can also be placed below the Right Shoulder as a more conservative point.
Select the H&S drawing by clicking on it. You will know the drawing is selected when boxes appear on the corners. Click on a box and drag it to your desired length. Release the mouse button to place.
Select the H&S drawing by clicking on it. The tool is selected when boxes appear at the LS, H, and RS end points. Drag to the new location and release the mouse button to place.
Select the H&S drawing by clicking on it. Press the Del (Delete) key on your keyboard. You can also right-click the drawing and select “Delete” from the dropdown menu.
Select the H&S drawing by clicking on it. The properties will appear in the preferences section of your control panel. Or you can right click on a drawn Head & Shoulders tool and select Properties.
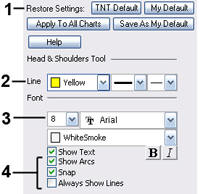
1. Restore Settings: TNT Default will change your settings back to the original software settings. My Default will change current settings to your personalized default settings. Apply To All Charts will apply your selected settings on all open charts. Save As My Default will save your current personal settings.
2. Line: From here you can choose the color, line style, and line thickness.
3. Text: Select the font, size, and color of the text. Select Show Text to hide or show your text on the chart.
4. Show Arcs: Select to hide/show arcs on points of the H&S drawing. Snap: Allows the H&S drawing to snap to price bars when moved. Always Show Lines: Select to keep lines the H&S drawings displayed always.

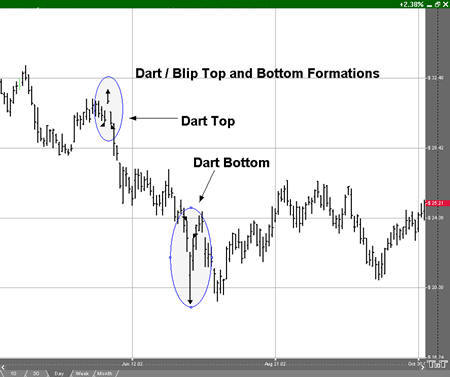
To chart a Dart Up or Down formation, select the Dart/Blip tool from your Advanced Charting toolbar. Click your mouse on the Left Feather (LF). Move to the Tip of the dart and click your mouse again. Click on the Right Feather to finish your dart.
The Dart/Blip formation occurs when there is a dramatic price change which is followed by an equally dramatic price change.
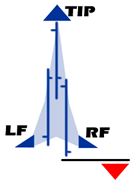
Dart Up
This formation is a sudden dramatic price increase followed by an equally dramatic drop in price. A dart formation can appear anywhere in a chart.
To trade a dart up, place a sell order on the break down of the Right Feather (RF) along with a stop loss order just above the Tip.
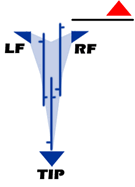
Dart Down
This formation is where a sudden dramatic price decrease occurs followed by an equally dramatic increase in price. A dart formation can appear anywhere in a chart
Place a buy order on the break up of the Right Feather, and place a stop loss order right below the Tip.
Trading on a Dart Formation is extremely risky.
Select the drawing by clicking on it. You will know the drawing is selected when boxes appear at the corners. Click on a box and drag it to your desired location. Release the mouse button to place.
Select the drawing by clicking on it. Drag to the new location and release the mouse button to place.
Select the drawing by clicking on it. Press the Del (Delete) key on your keyboard. You can also right-click the drawing and select “Delete” from the dropdown menu.
Select the drawing by clicking on it. The properties will appear in the preferences section of your control panel. Or you can right click on a drawn dart tool and select Properties.
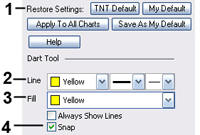
1. Restore Settings: TNT Default will change your settings back to the original software settings. My Default will change current settings to your personalized default settings. Apply To All Charts will apply your selected settings on all open charts. Save As My Default will save your current personal settings.
2. Line: From here you can choose the color, line style, and line thickness.
3. Fill: Select the color of your point triangles.
4. Always Show Lines: Select to keep dart/blip displayed always. Snap: Allows the dart/blip line to snap to price bars when moved.

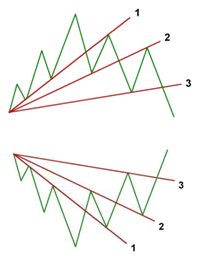
Identify any type of wedge or triangle by selecting the Wedge tool from your Charting toolbar. Position the mouse pointer where you would like to place the top point of the triangle and click. Move to the bottom point of the triangle and click again. Position the mouse pointer where you would like to place the final point of the triangle and click to place.
The wedge formation occurs when the slope of price bar highs and lows consolidate to a point. The triangle formation occurs when there is a pause in the current trend.
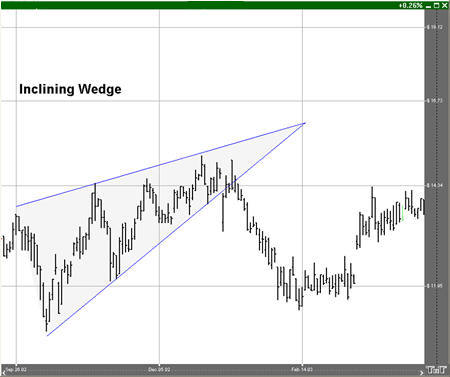
 Inclining Wedge
The Inclining Wedge formation occurs when the slope of both lines is up with the lower line being steeper then the higher one.
To trade the Inclining Wedge, place a buy on a break up and out of the wedge or a sell order on a break down and out of the wedge. Inclining Wedges with a prior downtrend are anticipated to break down and out, rather than up and out.
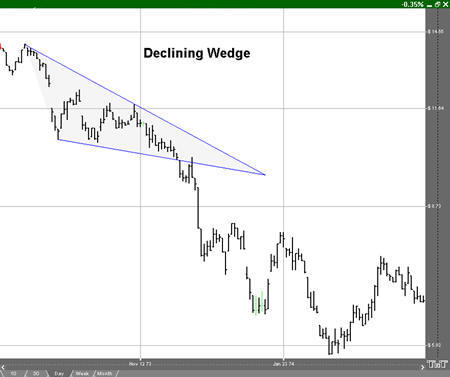
 Declining Wedge
The Declining Wedge formation occurs when the slope of both lines is down, the top line being steeper then the lower one. This formation is opposite the Inclining Wedge.
Trade the Declining Wedge the same as the Inclining Wedge. Declining Wedges with a prior uptrend are anticipated to break up and out, rather than down and out.
 Symmetrical Triangle
A Symmetrical Triangle is likely to resume the previous trend after the pause forming the triangle. Notice the price bars form a perfect symmetrical triangle shape.
To trade a Symmetrical Triangle, place a buy order on a break up and out of the triangle or a sell order on a break down and out of the triangle.
 Non-Symmetrical Triangle
A Non-Symmetrical Triangle is exactly the same as the Symmetrical Triangle, except lacking symmetry. The formation resumes the previous trend when a break occurs.
Trade a Non-Symmetrical Triangle just as you would a Symmetrical Triangle.
Select the drawing by clicking on it. You will know the drawing is selected when boxes appear at the corners. Click on a box and drag it to your desired location. Release the mouse button to place.
Select the drawing by clicking on it. Drag to the new location and release the mouse button to place.
Select the drawing by clicking on it. Press the Del (Delete) key on your keyboard. You can also right-click the drawing and select “Delete” from the dropdown menu.
Select the drawing by clicking on it. The properties will appear in the preferences section of your control panel. Or you can right click on a drawn Wedge tool and select Properties.
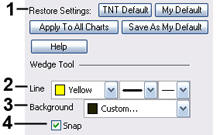 1. Restore Settings: TNT Default will change your settings back to the original software settings. My Default will change current settings to your personalized default settings. Apply To All Charts will apply your selected settings on all open charts. Save As My Default will save your current personal settings.
2. Line: From here you can choose the color, line style, and line thickness.
3. Background: Select the color you would like filled into the triangle or wedge.
4. Snap: Allows the drawing to snap to price bars when moved.

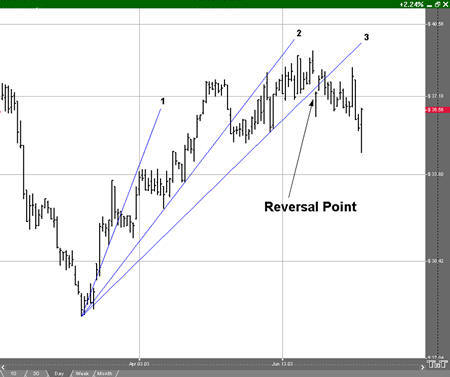
Identify a trend fan within a chart by selecting the Trend Fan tool from your Charting toolbar. Position the mouse pointer where you would like to place the main point of your trend fan. Move the mouse pointer to the end of the first line and click. Add as many lines of your trend fan as you would like. To place the last trend, position the mouse pointer at the end of the last line and right-click to place.
Trend Fans are an extension of the regular trend line. They accent simple trend line trading concepts by extending the single trend line to multiple fan lines that give a better look at a trend, its retracements, and market reversals.
Trend Fan
As a trend moves up in scale, a chartist will draw a line across price bar lows or, when a market is moving down, across the price bar highs.
AAs the market continues to make its retracement, we can draw another trend line across the next level of support or resistance. The line is support if the market is moving up and resistance if it is moving down.
The last move of the trend was resistance for the first trend line, and is now support for the second trend line. The third trend line shows that the market has made a solid retracement down past this third fan line.
When the market crosses the third fan line, it is considered to be confirmation of market retracement. A market that was once considered bullish is now bearish, or if bearish, would now be considered bullish. When the markets price bars cross above or below the third trend fan line, this is your signal and confirmation that the market has shifted from bullish to bearish, or bearish to bullish.
To trade a Trend Fan, place an order to enter the market on the break out past the third Trend Fan line.
Select the drawing by clicking on it. You will know the drawing is selected when boxes appear at the ends of the lines. Click on a box and drag it to your desired location. Release the mouse button to place.
Select the drawing by clicking on it. Drag to the new location and release the mouse button to place.
Select the drawing by clicking on it. Press the Del (Delete) key on your keyboard. You can also right-click the drawing and select “Delete” from the dropdown menu.
Select the drawing by clicking on it. The properties will appear in the preferences section of your control panel. Or you can right click on a drawn trend fan tool and select Properties.
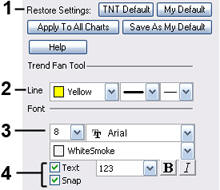
1. Restore Settings: TNT Default will change your settings back to the original software settings. My Default will change current settings to your personalized default settings. Apply To All Charts will apply your selected settings on all open charts. Save As My Default will save your current personal settings.
2. Line: From here you can choose the color, line style, and line thickness.
3. Font: Select the font, size, and color of the text. Select Text to hide or show your text on the chart.
4. Snap & Extend: Select to have the drawing snap to price bars when moved. Select Extend for linear extensions to the edge of your chart.
5. Line Label: Select from different options for labeling your trend fan lines.

Identify an Inclining or Declining Channel by selecting the Trend Channel tool from your Charting toolbar. Position the mouse pointer where you would like to place the top-left point of the channel and click. Move to the bottom-left point and click again. Move to the bottom-right point and click again. Position the mouse pointer where you would like to place the top-right final point of your channel and click to place.
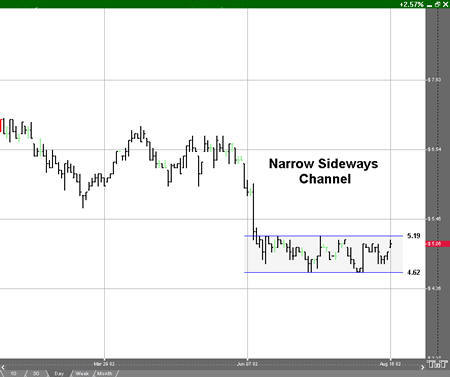
A trend channel consists of a section of price bars that are between parallel support and resistance lines. There are three types of channels: the Narrow Sideways Channel, the Inclining Channel, and the Declining Channel.
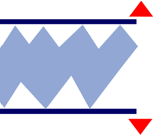 Narrow Sideways Channel
A Narrow Sideways channel is a formation that features both resistance and support with a sideways movement. Support forms the low price bar, while resistance provides the price ceiling.
To trade a Narrow Sideways channel, place an order to buy on a break up and out of the channel, or sell on a break down and out of the channel.
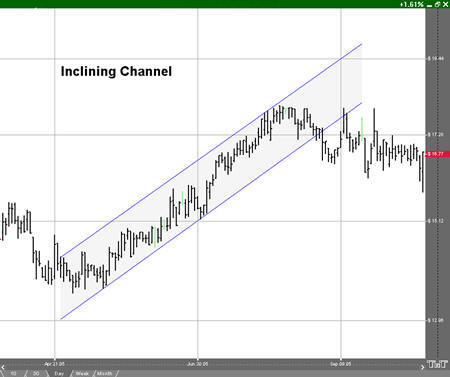
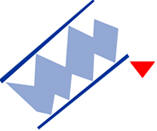 Inclining Channel
The Inclining channel is a formation with parallel price barriers along both the price ceiling and floor. Unlike the Narrow Sideways channel, the Inclining channel has an increase in both the price ceiling and price floor. The breaking of the bottom trend line on this formation shows a change in trend from bullish to bearish.
To trade an Inclining channel, place an order to sell on the break down and out of the channel.
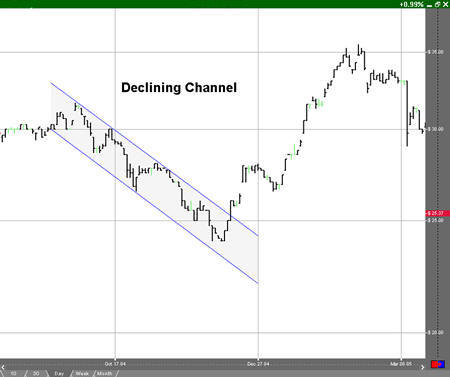
Declining Channel
The Declining channel is the exact opposite of the Inclining channel formation. The Declining channel has a decrease in both the price ceiling and price floor. The breaking of the top trend line on this formation shows a change in trend from bearish to bullish.
To trade a Declining channel, place an order to buy on the break up and out of the channel.
Select the channel by clicking on it. You will know the channel is selected when boxes appear at the corners. Click on a box and drag it to your desired location. Release the mouse button to place.
Select the channel by clicking on it. Drag to the new location and release the mouse button to place.
Select the channel by clicking on it. Press the Del (Delete) key on your keyboard. You can also right-click the channel and select “Delete” from the dropdown menu.
Select the channel by clicking on it. The properties will appear in the preferences section of your control panel. Or you can right click on a drawn Trend Channel tool and select Properties.
Restore Settings: TNT Default will change your settings back to the original software 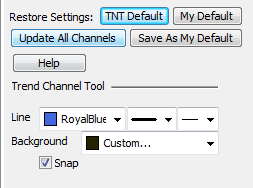 settings. My Default will change current settings to your personalized default settings. Apply To All Charts will apply your selected settings on all open charts. Save As My Default will save your current personal settings.
Line: From here you can choose the color, line style, and line thickness.
Background: Select the color you would like filled into the triangle or wedge.
Snap: Allows the drawing to snap to price bars when moved.

Illustrate a Horizontal channel in a chart by selecting the Horizontal Channel tool from your Charting toolbar. Position the mouse pointer where you would like to place the top-left point of the channel and click. Continue to hold down the mouse and drag it to the bottom-right point of your channel. Release the mouse button to place.
Select the Horizontal channel by clicking on it. You will know the channel is selected when boxes appear on the corners. Click on a box and drag it to your desired location. Release the mouse button to place.
Select the Horizontal channel by clicking on it. Drag to the new location and release the mouse button to place.
Select the Horizontal channel by clicking on it. Press the Del (Delete) key on your keyboard. You can also right-click the channel and select “Delete” from the dropdown menu.
Select the Horizontal channel by clicking on it. The properties will appear in the preferences section of your control panel. Or you can right click on a drawn horizontal channel tool and select Properties.
 1. Restore Settings: TNT Default will change your settings back to the original software settings. My Default will change current settings to your personalized default settings. Apply To All Charts will apply your selected settings on all open charts. Save As My Default will save your current personal settings.
2. Line: From here you can choose the color, line style, and line thickness.
3. Font: Select the font, size, and color of the text. You can also choose to see numbers or letters. Select Text to hide or show your text on the chart.
4. Snap: Allows the drawing to snap to price bars when moved.

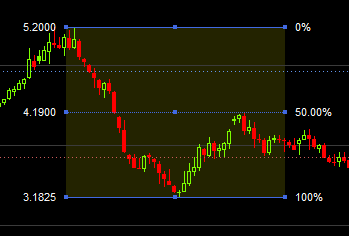
You can measure a retracement by selecting the N% tool from your Charting toolbar. Position the mouse pointer where you would like to place the top-left point of the channel and click. Continue to hold down the mouse button and drag to the bottom-right point of the channel. Release mouse button to place. The default on this charting tool is 50%. (For more information on retracements, see Fibonacci Time Zone and Fan tools in the Advanced Charting Tools section.)
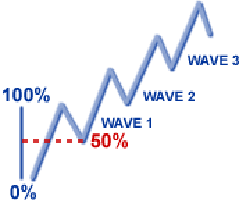 Up Trend (Bull Market)
In the diagram to the left, the market is in an overall uptrend; however, within the uptrend are small areas where the market falls back, or "retraces," each time establishing a new higher high.
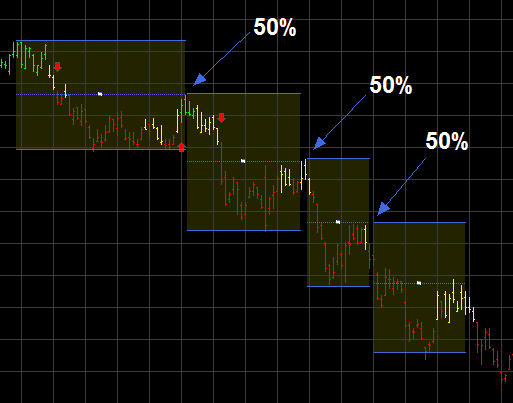 Down Trend (Bear Market)
This chart shows how the market made lower highs and lower lows, while still maintaining the overall down trend. Each retracement was about 50% of the last move before they continued on in their original direction.
Markets have a tendency to retrace half of the last move in overall long-term trends.
Select the channel by clicking on it. You will know the channel is selected when boxes appear on the corners. Click on a box and drag it to your desired location. Release the mouse button to place.
Select the channel by clicking on it. Drag to the new location and release the mouse button to place.
Select the channel by clicking on it. Notice the box in the center of the middle line. Click and drag the box to move the line. As you change the position of the percentage line, the percentage value to the left will change as well.
Select the channel by clicking on it. Press the Del (Delete) key on your keyboard. You can also right-click the channel and select “Delete” from the dropdown menu.
Select the channel by clicking on it. The properties will appear in the preferences section of your control panel. Or you can right click on a drawn N% ruler tool and select Properties.
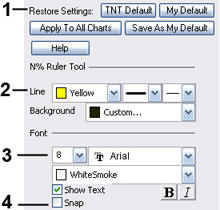 1. Restore Settings: TNT Default will change your settings back to the original software settings. My Default will change current settings to your personalized default settings. Apply To All Charts will apply your selected settings on all open charts. Save As My Default will save your current personal settings.
2. Line: From here you can choose the color, line style, and line thickness.
3. Font: Select the font, size, and color of the text. You can also choose to see numbers or letters. Select Text to hide or show your text on the chart.
4. Snap: Allows the drawing to snap to price bars when moved.
![]()
The Arrow tool enables you to draw arrows to help point out areas of interest on your chart. Position the mouse pointer where you want to place the point of the arrow and click the mouse button. Drag the mouse pointer to the location you would like to end the arrow. Release the mouse button to place.
Select the arrow drawing by clicking on it. The arrow is selected when boxes appear at the ends of the line. Click on one of the boxes and drag it to the desired length. Release the mouse button to place the end point of the line.
Select the arrow drawing by clicking on it. Click on the arrow, not an end box, and drag it to the new location. Release the mouse button to place.
Select the arrow drawing by clicking on it. Press the Del (Delete) key on your keyboard. You can also right-click the line drawing and select "Delete" from the dropdown menu.
Select the drawing by clicking on it. The properties will appear in the preferences section of your control panel. Or you can right click on a drawn arrow tool and select Properties.
![]() 1. Restore Settings: TNT Default will change your settings back to the original software settings. My Default will change current settings to your personalized default settings. Apply To All Charts will apply your selected settings on all open charts. Save As My Default will save your current personal settings.
1. Restore Settings: TNT Default will change your settings back to the original software settings. My Default will change current settings to your personalized default settings. Apply To All Charts will apply your selected settings on all open charts. Save As My Default will save your current personal settings.
2. Line: From here you can choose the color, line style, and line thickness of an arrow.
3. Arrow Fill: This option allows you to choose the fill color of the arrow point(s).
4. Arrow Point: This option allows you to choose which end you would like the arrow point to be placed. Choose from "on end one", "on end two", or "on both ends".
5. Snap: Select this option to place an arrow end directly on a price bar. You can snap to open, high, low, or close.

The Flag tool enables you to place a flag or a graphic on your chart. There is a basic set of flags available to choose from or you can import custom flags. Select the Flag tool from the Notation toolbar. Click on the chart where you would like the top of the Flag. The default flag will be placed in this location.
Select the flag drawing by clicking on it. The flag is selected when boxes appear at the corners of the graphic. Click on one of the boxes and drag it to the desired length. Release the mouse button to place.
Select the flag drawing by clicking on it. Click on the flag, not an end box, and drag it to the new location. Release the mouse button to place.
Select the flag drawing by clicking on it. Press the Del (Delete) key on your keyboard. You can also right-click the line drawing and select "Delete" from the dropdown menu.
Select the flag drawing by clicking on it. The properties will appear in the preferences section of your control panel. Or you can right click on a drawn flag tool and select Properties.
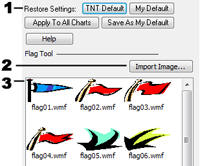 1. Restore Settings: TNT Default will change your settings back to the original software settings. My Default will change current settings to your personalized default settings. Apply To All Charts will apply your selected settings on all open charts. Save As My Default will save your current personal settings.
2. Import Image: Click on this button to import any custom image as a flag. Importable formats are .wmf, .jpeg, and .gif. Click on any of these flags to display in your chart.
3. Flag Window: This window shows a list of the default flags included in the software.
The Text tool enables you to type text on the Chart. Select the Text toll in the Notation toolbar. Click on the chart where you would like to place the upper left corner of the text box. Drag the text box to the lower right corner of your desired text box. Release the mouse button to place.
Once the box is drawn, the Text Tool Options window will open. Enter the text, set the font, size, position, color, and style of the text. Select a border and background if you would like. Click "OK" when finished and text will be place on your chart.
Select the text box by clicking on it. Continue holding down the mouse button to drag text to the new location. Release mouse button to place.
Select the text box by clicking on it. Press the Del (Delete) key on your keyboard. You can also right-click the text box and select "Delete" from the dropdown menu.
Select the text box by clicking on it. The properties will appear in the preferences section of your control panel. Or you can right click on a drawn text tool and select Properties.
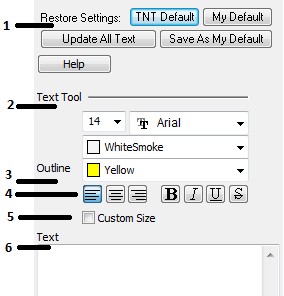
1. Restore Settings: TNT Default will change your settings back to the original software settings. My Default will change current settings to your personalized default settings. Apply To All Charts will apply your selected settings on all open charts. Save As My Default will save your current personal settings.
2. Text Tool: You can change the size, font, and color of the text.
3. Outline: Click on the down arrow to view a list of colors for the outline of the text box.
4. Alignment and Font Style: These buttons determine how you want your text to appear on the chart. You can align the text left, center, or right, and can also bold, italicize, underline, and strikethrough.
5. Custom Size: Select this check-box to manually adjust the size of the Text Tool window.
6. Text: Use the Text entry window to cut, copy, or paste information.
The Box tool enables you to draw square or rectangle shaped drawings on the chart. Select the Box tool in the Notation toolbar. Click where you would like to place the top-left corner of the box, hold down the mouse button and drag to the location of the bottom-right corner of the box. Release the mouse button to place.
Select the rectangle drawing by clicking on it. The drawing is selected when boxes appear at the corners of the graphic. Click on one of the boxes and drag it to the desired length. Release the mouse button to place.
Select the rectangle drawing by clicking on it. Click on the drawing, not an end box, and drag it to the new location. Release the mouse button to place.
Select the rectangle drawing by clicking on it. Press the Del (Delete) key on your keyboard. You can also right-click the line drawing and select "Delete" from the dropdown menu.
Select the drawing by clicking on it. The properties will appear in the preferences section of your control panel. Or you can right click on a drawn box tool and select Properties.
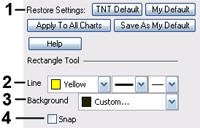 1. Restore Settings: TNT Default will change your settings back to the original software settings. My Default will change current settings to your personalized default settings. Apply To All Charts will apply your selected settings on all open charts. Save As My Default will save your current personal settings.
2. Line: Choose the color, style, and thickness of the line surrounding the box.
3. Background: Change the fill color of the box.
4. Snap: Select this option to place a box corner directly on a price bar. You can snap to open, high, low, or close.
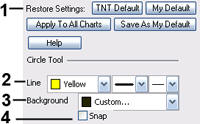
The Circle tool enables you to draw circle shaped drawings on the chart. Select the Circle tool in the Notation toolbar. Click on the chart where you would like the circle to start. Continue holding down the mouse button and drag the tool until it has formed a circle. Release the mouse button to place.
Select the circle drawing by clicking on it. The circle is selected when boxes appear at the corners of the graphic. Click on one of the boxes and drag it to the desired length. Release the mouse button to place.
Select the circle drawing by clicking on it. Click on the box, not an end box, and drag it to the new location. Release the mouse button to place.
Select the circle drawing by clicking on it. Press the Del (Delete) key on your keyboard. You can also right-click the line drawing and select "Delete" from the dropdown menu.
Select the circle drawing by clicking on it. The properties will appear in the preferences section of your control panel. Or you can right click on a drawn circle tool and select Properties.
 1. Restore Settings: TNT Default will change your settings back to the original software settings. My Default will change current settings to your personalized default settings. Apply To All Charts will apply your selected settings on all open charts. Save As My Default will save your current personal settings.
2. Line: Choose the color, style, and thickness of the line surrounding the circle.
3. Background: Change the fill color of the circle.
4. Snap: Select this option to place the circle directly on a price bar. You can snap to open, high, low, or close.

Use the Dollar calculator to find the dollar value between two points on the chart. Select the Dollar calculator tool from your Calculators toolbar. Click on your chart where you want the calculator to start and drag to where you want the calculation to be completed. Release the mouse button to place. The dollar amount of the chart movement will be calculated from the beginning and end point values and will be displayed in the center of the line.
Select the drawing by clicking on it. You will know the drawing is selected when boxes appear at the corners. Click on a box and drag it to your desired location. Release the mouse button to place.
Select the drawing by clicking on it. Hold down the mouse button and drag to the new location. Release the mouse button to place.
Select the drawing by clicking on it. Press the Del (Delete) key on your keyboard. You can also right-click the channel and select "Delete" from the drop-down menu.
Select the dollar calculator by clicking on it. The properties will appear in the preferences section of your control panel. Or you can right click on a drawn dollar calculator tool and select Properties.
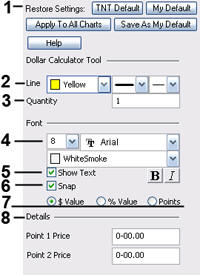
1. Restore Settings: TNT Default will change your settings back to the original software settings. My Default will change current settings to your personalized default settings. Apply To All Charts will apply your selected settings on all open charts. Save As My Default will save your current personal settings.
2. Line: Choose the color, style, and thickness of the line.
3. Quantity: Shows the number of shares/contracts included in the calculator transaction. Select and type the desired quantity to change the value.
4. Font: From here you have the ability to change the size, font, and color of the text.
5. Show Text: Uncheck this box to hide the text.
6. Snap: Select this option to place the circle directly on a price bar. You can snap to open, high, low, or close.
7. Value / % Value / *Pips *fx only: In Track n’ Trade Live Forex you can choose to display the dollar calculator as a $ Value, % Value, or as Pips.
8. Details: This section gives you the price value of Point 1 and Point 2 on the Dollar Calculator. You can modify these values by highlighting and typing a new value.

The Risk/Reward calculator is used to find the difference between two points of the risk and reward zone. Select the Risk/Reward tool on your Calculators Toolbar. Click on your chart where you want your technical formation to begin and drag to cover the area between your initial order and your risking stop loss order.
The calculator will create an equal-sized reward area that can be stretched to the proper distance you expect the graph to retrace. The numbers in the tool indicate the dollar amount of risk and reward.
When the chart is trading within the risk area (negative number), you are risking your own money. When the chart is trading within the reward area (positive number), you are risking OPM or "Other People’s Money." Use the Risk/Reward calculator on all trades to calculate where your order entries and exits should be placed.
Select the drawing by clicking on it. You will know the drawing is selected when boxes appear at the corners. Click on a box and drag it to your desired location. Release the mouse button to place.
Select the drawing by clicking on it. Hold down the mouse button and drag to the new location. Release the mouse button to place.
Select the drawing by clicking on it. Press the Del (Delete) key on your keyboard. You can also right-click the channel and select "Delete" from the drop-down menu.
Select the risk vs. reward by clicking on it. The properties will appear in the preferences section of your control panel. Or you can right click on a drawn risk vs. reward tool and select Properties.
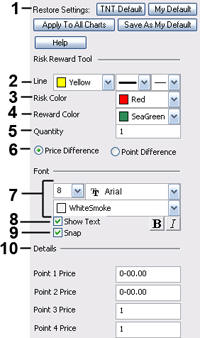
1. Restore Settings: TNT Default will change your settings back to the original software settings. My Default will change current settings to your personalized default settings. Apply To All Charts will apply your selected settings on all open charts. Save As My Default will save your current personal settings.
2. Line: Choose the color, style, and thickness of the line.
3. Risk Color: Change the highlight color of the Risk text.
4. Reward Color: Change the highlight color of the Reward text.
5. Quantity: See Dollar Calculator Preference Tab.
6. Price/Point Difference: Either view the Point or Price difference of the risk and reward calculator.
7. Font: Change the size, font, and color of the text.
8. Show Text: Uncheck this box to hide the text.
9. Snap: Select this option to place the circle directly on a price bar. You can snap to open, high, low, or close.
10. Details: This section gives you the price value of Point 1 and Point 2 on the Risk/Reward Calculator.

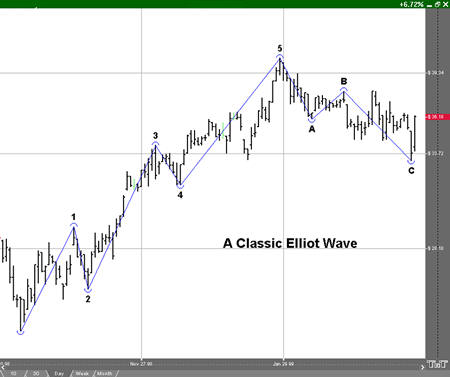
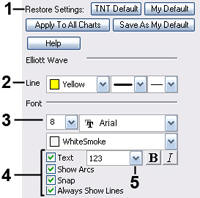
To identify an Elliott Wave on a chart, select the Elliott Wave tool from your Advanced Charting toolbar. Click on the first point to place. Continue throughout the wave by clicking on each point 1-5 and ABC to place. When you get to the last point, C, the drawing is complete.
The Elliott Wave theory was developed by Ralph Nelson Elliott. He suggested that the market behavior is based on waves rather than random timing. He believed that market prices rose and fell in a series of waves based on the same Golden Ratio or Golden Mean that Fibonacci proved.
Interpretation
The basic idea of the Elliott Wave theory is that a market rises in a series of five "waves" (as he called them), and a market declines in a series of three declines. Elliott’s said the market rises on the first wave, declines on the second, begins to rise again on wave three, has a period of decline again on wave four, and finally completes the rise on wave five. The period of correction is referred to as a three-wave correction where the market declines for wave A, begins to rise for wave B, and falls again for wave C.
Elliott went on to further explain that a complete market cycle consisted of a 144 wave cycle, broken down into an 89 wave bull cycle, and a 55 wave bear cycle. This is based on his observation of Fibonacci’s Golden Ratio. The series of numbers Fibonacci describes shows a relationship of 1:0.618. Elliott further showed that a market usually rises or falls based on this wave cycle. Each wave in the cycle has its own characteristics.
Five Wave Advance
One: Normally very short and easy to miss.
Two: A retracement wave. Gives back all or most of what the first one gained.
Three: Usually very prominent. Follows a period of what appears as a consolidation, most people trade this wave.
Four: Noted to be very intricate, yet still a consolidation. One of Elliott’s main rules is that in a five-wave advance cycle, wave four can’t overlap wave one.
Five: Often very active. At some point declines and lead to the three wave corrective cycle.
Three Wave Decline
A: Normally seen as a minor pullback of wave five of the advance cycle.
B: Follows A of the downtrend and is often hard to spot. Should result in a third wave continuing down.
C: Usually quite significant and many traders see this as a selling opportunity. The price bars form a perfect symmetrical triangle shape.
Select the drawing by clicking on it. You will know the drawing is selected when boxes appear at the corners. Click on a box and drag it to your desired location. Release the mouse button to place.
Select the drawing by clicking on it. Drag to the new location and release the mouse button to place.
Select the drawing by clicking on it. Press the Del (Delete) key on your keyboard. You can also right-click the drawing and select "Delete" from the dropdown menu.
Select the drawing by clicking on it. The properties will appear in the preferences section of your control panel.
 1. Restore Settings: TNT Default will change your settings back to the original software settings. My Default will change current settings to your personalized default settings. Apply To All Charts will apply your selected settings on all open charts. Save As My Default will save your current personal settings.
2. Line: From here you can choose the color, line style, and line thickness.
3. Font: Select the font, size, and color of the text. You can also choose to bold or italicize.
4. Show Text / Show Arcs/ Snap / Always Show Lines: Select the checkbox next to Text and Show Arcs to hide/show the text and arcs on the chart. Select Snap to snap the Elliot Wave Tool to price bars. Select Always Show Lines to display a line between each Elliot Wave Point
5. Points: Change how the points of the Elliot Wave are labeled from the points drop down dialog box.
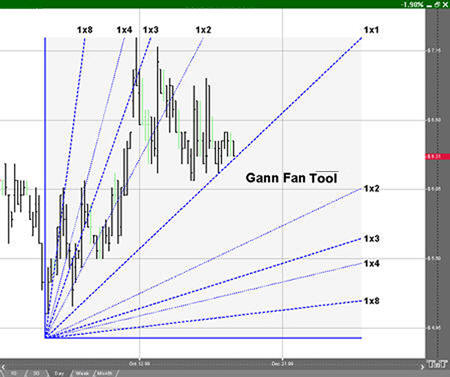
You can apply this theory to your charts by selecting the Gann Fan from drawing tools toolbar. Click where you want the Fan to start and continue to hold down the mouse button until reaching the top-right position of the fan. Release the mouse button to place.
W. D. Gann designed several techniques for studying price charts. One of these included the use of geometric angles in conjunction with time and price. Gann believed that specific geometric patterns and angles had unique characteristics that could be used to predict price action.
Gann’s techniques require that charts be drawn with equal time and price intervals, so that a rise/run of one price unit for each time unit (called a 1 x 1 trend or angle) will equal a 45 degree angle anywhere on the chart. Gann believed that the ideal balance between time and price exists when prices rise or fall at a 45 degree angle relative to the time axis.
Interpretation
A Gann Fan is used to define a market direction or a new trend. For example, a bull market exists if prices are maintaining strength between the 1x2 lower line and 1x2 higher line. A bear market would be the exact opposite of the previous scenario. The Gann Fan is made up of nine angles based on this concept. These trend lines are used to indicate support and resistance levels. When one line is broken (by the entire days price range) prices should move to the next line. The drawing of these lines should start from either a market top or bottom.
It is important to note that this theory is based on a squared 45 degree angle on the chart. Obviously, a 45 degree angle drawn on a chart is no longer 45 degrees when the scale is changed without a change to the opposite scale as well. To "square" the Gann Fan to the current chart’s scaled settings, hold down the CTRL key on your keyboard while clicking and rescaling with the mouse pointer. Some Gann experts have reported that to get a truly "squared" chart, one must set the scaling to 8 price bars per inch for the width and 4 price bars per inch for the height.
Select the drawing by clicking on it. You will know the drawing is selected when boxes appear at the corners. Click on a box and drag it to your desired location. Release the mouse button to place.
Select the drawing by clicking on it. Drag to the new location and release the mouse button to place.
Select the drawing by clicking on it. Press the Del (Delete) key on your keyboard. You can also right-click the drawing and select “Delete” from the dropdown menu.
Select the drawing by clicking on it. The properties will appear in the preferences section of your control panel.
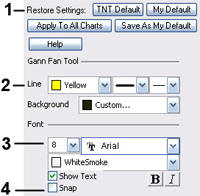 1. Restore Settings: TNT Default will change your settings back to the original software settings. My Default will change current settings to your personalized default settings. Apply To All Charts will apply your selected settings on all open charts. Save As My Default will save your current personal settings.
2. Line: From here you can choose the color, line style, and line thickness.
3. Font: Select the font, size and color. You can also choose to bold or italicize your text.
4. Snap: Select to have the drawing snap to the price bars.

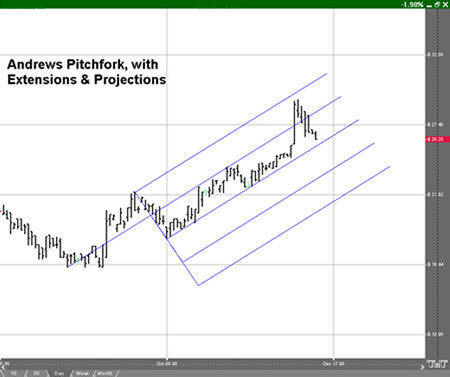
You can apply this theory to your charts by selecting the Andrews Pitchfork from your drawing tools toolbar. Click where you want the handle of the pitchfork to be (at the end of the previous trend). Your next two clicks will form the base of the fork, or the tops of the next two trends. You can elongate the pitchfork to the length desired. Click to place.
Dr. Alan Andrews developed a channel technique to show areas of support and resistance from a baseline. This use of a median line is the key to using the Andrews Pitchfork. Buying near lows and selling near highs that are identified by the "tines" of the pitchfork. The basic premise is to trade the channel from one level of support or resistance to the next.
Interpretation
The first element to draw the Andrews Pitchfork is the centerline. The middle tine, or median line, begins at the most recent contract low or high. To plot the direction of this point we must attain the other two points. The top tine is determined by looking at the highest move made from the origin of the contract low or high. The next point is found by looking at the retracement of that move. For example, a contract begins at point A, rallies to point B, and sells off from point B to point C. A line is drawn from point B to point C, and the line originating at point A splits those two lines equally.
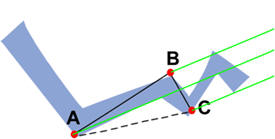 This pitchfork shows continuing points of support and resistance. The general use of this tool is to sell when the market rises to line B, take profits once prices reach line A, and buy when prices dip to line C. This series of movements within the pitchfork affords traders the opportunity to trade a channel system within a trending market.
Select the drawing by clicking on it. You will know the drawing is selected when boxes appear at the corners. Click on a box and drag it to your desired location. Release mouse button to place.
Select the drawing by clicking on it. Drag to the new location and release the mouse button to place.
Select the drawing by clicking on it. Press the Del (Delete) key on your keyboard. You can also right-click the channel and select “Delete” from the dropdown menu.
Distance scaling is determined from the starting point of the Pitchfork handle to the middle cross line.
Select the drawing by clicking on it. The properties will appear in the preferences section of your control panel.
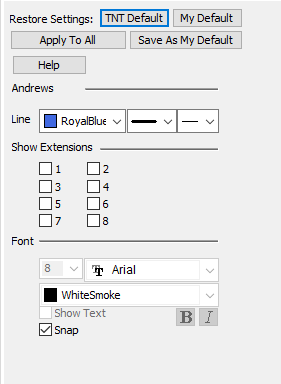 Restore Settings: TNT Default will change your settings back to the original software settings. My Default will change current settings to your personalized default settings. Apply To All Charts will apply your selected settings on all open charts. Save As My Default will save your current personal settings.
Line: From here you can choose the color, line style, and line thickness.
Show Extensions: Select the box next to the number of extensions you wanted added to your pitchfork drawing. The odd numbers are placed below, even numbers are placed above.
Font: Select the font, size of font, and color of the text. You can also choose to bold or italicize your text. Select the checkbox next to Show Text to hide/show your text on the chart.
Snap: Allows the tool to snap to price bars when moved.
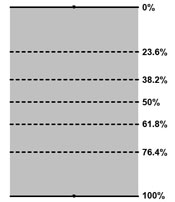
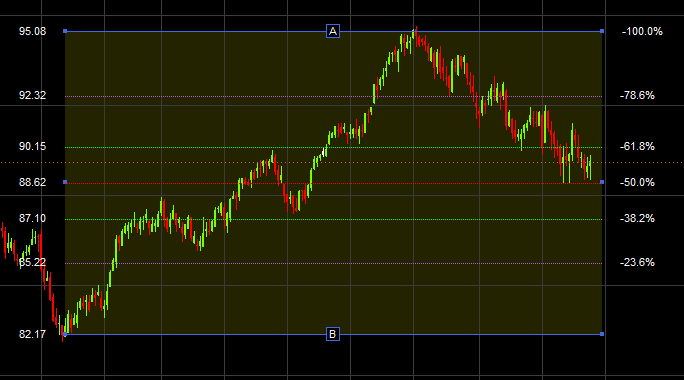
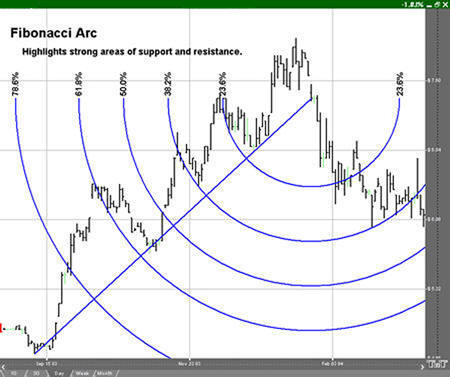
To measure the different retracement levels within a market, select the Fibonacci Ruler tool from your drawing tools toolbar. Click on the chart where you would like the ruler to begin. Hold the mouse button down and move to the lower right position of the rule. Release the mouse button to place.
Fibonacci Retracement levels correspond with percentage retracements that occur in the ebb and flow of a market trend. According to the Elliott Wave Theory, market trends tend to occur in five distinct waves. See the Elliott Wave section for more information. Elliott asserted that these counter-trend waves will usually retrace against the trending waves by 38.2, 50, and 61.8 percent. These retracement percentages correspond to natural ratios discovered by the Greeks called the Golden Ratio and rediscovered by Fibonacci, a medieval Italian Mathematician.
 Interpretation
Commodity prices will frequently consist of an initial wave, a second wave (often retracing 61.8% of the initial move), a third wave (usually the largest), another retracement, and finally a 5th wave (the last gap), which would exhaust the movement.
In Track ‘n Trade Live, you have three tools that you can use to apply these concepts: Fibonacci Retracement, Fibonacci Time Zones, and Fibonacci Arc.
Select the drawing by clicking on it. You will know the drawing is selected when boxes appear at the corners. Click on a box and drag it to your desired location. Release mouse button to place.
Select the drawing by clicking on it. Drag to the new location and release the mouse button to place.
Select the drawing by clicking on it. Press the Del (Delete) key on your keyboard. You can also right-click the drawing and select “Delete” from the dropdown menu.
With your Preferences Tab open, select the drawing by clicking on it. The properties will appear in the preferences section of your control panel. You may also right-click the drawing and select Properties to open the Fibonacci Ruler preferences within the Preferences Tab.
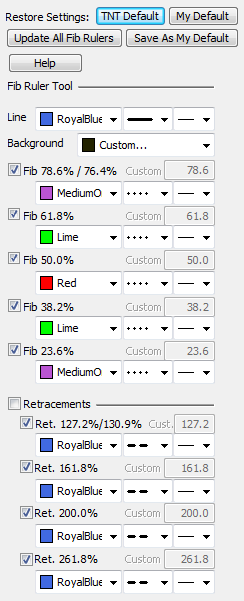 Restore Settings: TNT Default will change your settings back to the original software settings. My Default will change current settings to your personalized default settings. Apply To All Charts will apply your selected settings on all open charts. Save As My Default will save your current personal settings.
Line: From here you can choose the color, line style, and line thickness
Background: Select the color you want for the background of the Fibonacci Ruler.
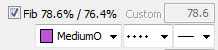
Fib: Default Fibonacci Ruler. Check, blue square, or uncheck to show, customize or hide Fibonacci lines.
Retracements: Check Retracements to display Fibonacci retracements values on your drawn Fibonacci Ruler.
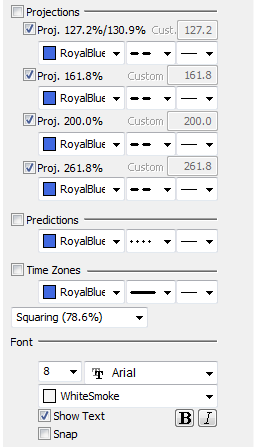 Projections: Check Projections to display Fibonacci projection values on your drawn Fibonacci Ruler.
Predictions: Check Predictions to display Fibonacci prediction values on your drawn Fibonacci Ruler.
Time Zones: Check Time Zones to display Fibonacci time zone values on your drawn Fibonacci Ruler.
Squaring / Division: Choose between displaying the Fibonacci Ruler being calculated as squared (78.6%) or displaying it as a division (76.4%).
Font: Select the font, size of font, and color of the text. You can also choose to bold or italicize your text. Select the checkbox next to Show Text to hide/show your text on the chart.
Snap: Select to have the Fibonacci Ruler snap to price bars when moved.
 Checked: line will appear with default Fibonacci values.
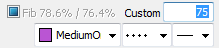 Blue square: line will appear with option to enter custom percentage value.
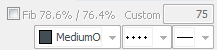 Unchecked: line will not appear within Fibonacci Ruler on chart.
To measure the different retracement levels within a market, select the Fibonacci Arc tool from your drawing tools toolbar. Move the mouse pointer to the point on the chart that will be the corner of your arc. Hold the mouse button and drag to your end point. Release the mouse button to place.
Select the drawing by clicking on it. You will know the drawing is selected when boxes appear at the corners. Click on a box and drag it to your desired location. Release the mouse button to place.
Select the drawing by clicking on it. Drag to the new location and release the mouse button to place.
Select the drawing by clicking on it. Press the Del (Delete) key on your keyboard. You can also right-click the drawing and select “Delete” from the dropdown menu.
Select the drawing by clicking on it. The properties will appear in the preferences section of your control panel.
1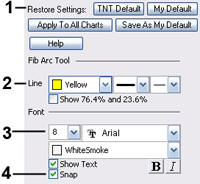 . Restore Settings: TNT Default will change your settings back to the original software settings. My Default will change current settings to your personalized default settings. Apply To All Charts will apply your selected settings on all open charts. Save As My Default will save your current personal settings.
2. Line: From here you can choose the color, line style, and line thickness.
3. Font: Select the font, size of font, and color of the text. You can also choose to bold or italicize your text. Select the checkbox next to Show Text to hide/show your text on the chart
4. Snap: Select to have the tool snap to price bars when moved.
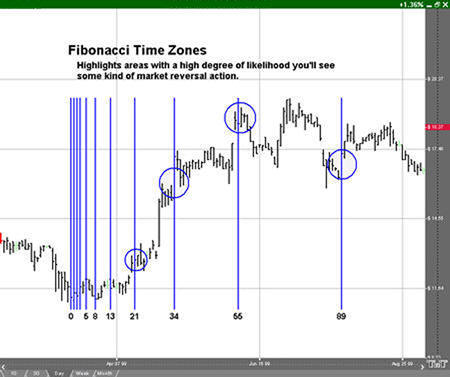
The Fibonacci Time Zone uses Fibonacci numbers rather than the percentages used in the Ruler and Arc tools. Select the Fibonacci Time Zones from your drawing tools toolbar. Click where you want the upper left point. Hold the mouse button and drag to the bottom right position. Release the mouse button to place.
Select the drawing by clicking on it. You will know the drawing is selected when boxes appear at the corners. Click on a box and drag it to your desired location. Release the mouse button to place.
Select the drawing by clicking on it. Drag to the new location and release the mouse button to place.
Select the drawing by clicking on it. Press the Del (Delete) key on your keyboard. You can also right-click the drawing and select “Delete” from the dropdown menu.
Select the drawing by clicking on it. The properties will appear in the preferences section of your control panel.
 Restore Settings: TNT Default will change your settings back to the original software settings. My Default will change current settings to your personalized default settings. Apply To All Charts will apply your selected settings on all open charts. Save As My Default will save your current personal settings.
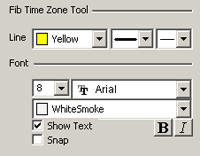
Fib Time Zone Tool: You can choose the color, line style, and line thickness of your lines.
Font: Select the font, size, and color of the text. Select Show Text to hide or show your text on the chart.
Select Snap to have your lines snap to price bars when moved.
Each toolbar can be customized to fit your trading needs. To customize a toolbar, place mouse over the toolbar and right click, then select Customize Toolbar.
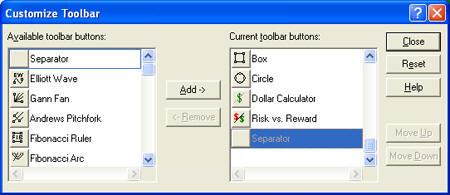
To add buttons, select desired buttons and click Add. To delete unwanted buttons, select and click Remove. To restore default buttons, click Reset. When you have made your changes, select Close to save your changes and return to the program.
Tools not on by default:
Flag Tool: Used to place a flag or graphic.