Toggle Autopilot Performance Analyses Screens
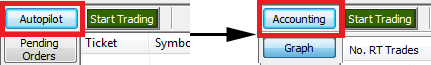
In the lower left corner is where the controls are located in the accounting portion of Track ‘n Trade. The Autopilot button is a two-state button that controls which “view” you are looking at. If you press the Autopilot button, you’ll notice that it switches the screen to reveal the autopilot performance analysis screens. Also note that the button now says, "Accounting." If you click the same button again, it flips you back over, revealing the current markets accounting information.
This section mainly deals with backtesting the Autopilot. However, the Logs section records the Forward test (running the autopilot) log notes.
The back testing values can be found right below the chart window.

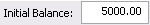
Initial Balance: Enter the amount you would like the Autopilot to start calculating from.
Fees: Enter in any trading fees you'll have for Futures. For Forex this should usually be $0.00 because the commission is included in the spread.

Start Analysis: The starting month, day, year, and time you would like the Autopilot to backtest from.

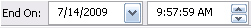
End On: The month, day, year, and time you would like the Autopilot to stop calculating.
Auto Date: Will automatically update your End On analysis date to the current date and time.

Auto Recalc: With this checked the backtesting calculations will change on the fly as you change your settings.

Calculate: This button is only available when the Auto Recalc is not checked. Use this to manually calculate backtest settings.

No. Trades: Number of trades the Autopilot would’ve placed in the allotted time.
Repeated Wins: The greatest number of winning trades in a row. Total positive (+) dollars.
Repeated Losses: The greatest number of losing trades in a row. Total negative (-) dollars.
Max Draw: Longest draw down without hitting a stop.
Biggest Win: The most profitable trade placed within the time period set.
Biggest Loss: The least profitable trade that went into negative dollars within the time period set.
Profitable Days: How many profitable days you’ve had on the Autopilot within the time period set. Days that had a total of positive (+) dollars.
Losing Days: How many losing days you’ve had on the Autopilot within the time period set. Days that had a total of negative (-) dollars.
Total Fees: Calculates the total of the trading fees.
Percent Gain: The percentage gain on your account within the time period set.
Closed P/L: The profit/loss of closed charts.
Open P/L: The profit/loss of charts currently opened.
Total P/L: Total profit/loss from your trades with the Autopilot.
Equity Performance Graph
Clicking the Graph button will bring up a line graph on the bottom-half of your screen that will allow you to see how your Autopilot settings would have done over any given period of time (as set in dates listed by the user).
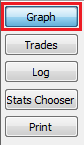
By right-clicking in the graph window, you receive a right-click menu, where you can make visual adjustments to the chart. You can select whether you would like to see the graph displayed as a line or histogram, whether the line chart is filled, and if you want to exclude the initial balance (Profit/Loss Only).
Clicking the Trades button will bring up a spreadsheet on the bottom-half of your screen to show all the details of each trade that has been placed with the Autopilot.
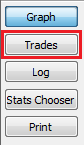
You’ll see each trade as they would historically have been executed from the current settings within the autopilot. In this list, you'll see each trade, whether it was a buy or sell, the entry and exit times, the profit and loss, fees and balances.
You'll notice that we have a column labeled "Daily Realized" that is that days profit or loss color coordinated.
By double-clicking on any single trade listed in the table, Track ‘n Trade will automatically center that trade on the screen, and highlight the buy or sell signal that generated that trade.This is helpful in analyzing individual trades, to see what adjustments might be made to the system, to help the statistical performance.
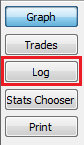
This log is used to analyze the live trading performance, allowing you to see each step taken by the system, and Track ‘n Trade's interaction with the market, and what intervention was taken by the user. This log is used for auditing the system to make sure it’s doing exactly what we expected.
*Important* If you find that a signal appeared in your chart but the Autopilot did not place a new trade, check the time of the signal in your chart, open the Log and scroll to that time. The Log will tell you which of your personal filters or Autopilot settings filtered out that particular trade entry.
This is where you find all the performance statistics for the Autopilot system and settings. In this row you'll find such things as the number of trades and percentage that were winners vs. losers, you'll find repeated wins, losses, and their calculated ratios. You'll find biggest winning trades, biggest losing trades, as well as a number of other statistical results based on your chosen settings.
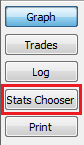
This row of statistics can be modified by right-clicking on the header and selecting "Column Setup" from within the right-click menu. This action will open a window that is full of different analytical results, choose just your favorites, or choose them all.
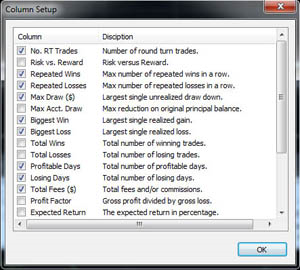
| Column Setup Options | |
| Column | Description |
| No. RT Trades | Number of round turn trades |
| Risk vs. Reward | Risk versus reward |
| Repeated Wins | Max number of repeated wins in a row |
| Repeated Losses | Max number of repeated losses in a row |
| Max Draw ($) | Largest single unrealized drawdown |
| Max Acct. Draw | Max reduction on original principal balance |
| Biggest Win | Largest single realized gain |
| Biggest Loss | Largest single realized loss |
| Total Wins | Total number of winning trades |
| Total Losses | Total number of losing trades |
| Losing Days | Total number of profitable trades |
| Total Fees ($) | Total fees and/or commissions |
| Profit Factor | Gross profit divided by gross loss |
| Expected Return | The expected return in percentage |
| Return Volatility | Standard Deviation (Sigma) Return Volatility |
| Sharpe Ratio | The expected return divided by Volatility |
| Trades Needed | The trades needed to be 99.9% accurate |
| % Gain | Percent gain from initial balance |
| Closed P/L ($) | Closed or realized profit or loss |
| Open P/L ($) | Open or unrealized profit or loss |
| Total P/L ($) | Total profit or loss |
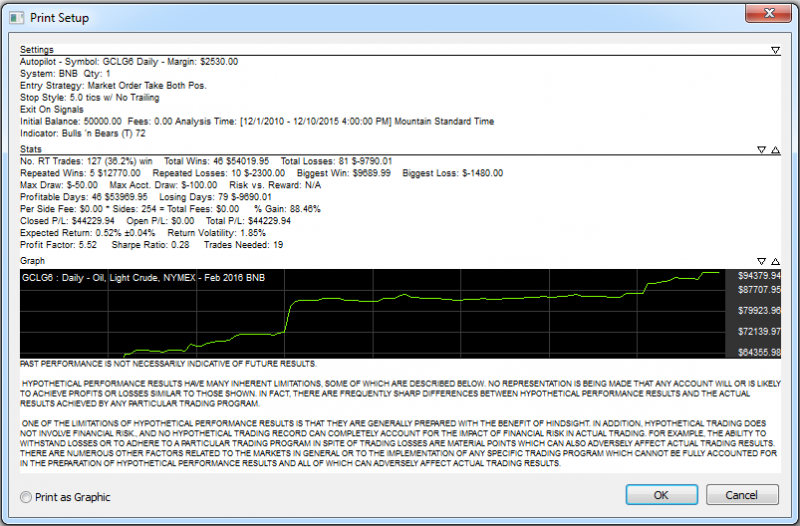
Pressing the Print button pulls up a visual report of all the settings that were used in the creation of this particular Expert Advisor, or trading strategy. Notice at the top, you have listed all the Autopilot settings, the stats for this trading strategy, the equity chart, and each individual trade for the timeframe specified that created this equity graph and return on our investment.
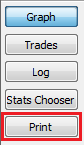
This report can be saved as a graphic by selecting this "Print as Graphic" radial button and pressing ok, or you can leave the radial button blank and print the report to your printer.