The control panel is on the right side of your screen. This section is where you may select charts, change preferences, make trades, and much more.
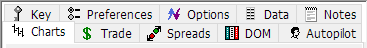
Example of Futures Control Panel Tabs:
Example of Forex Control Panel Tabs:
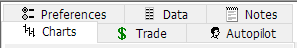
Each tab of the control panel has a specific purpose which is outlined in the sections below.
(For the Autopilot Tab see the Autopilot section [1] in Plug-Ins)
The Charts Tab will be used to open new charts or to switch between open charts within Track 'n Trade.
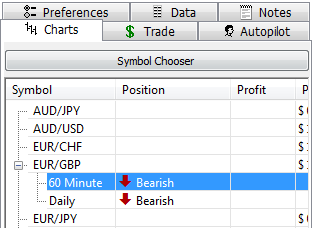 Forex users will see a list of all subscribed currency pairs and may simply double-click or right-click on the symbol name, then open time frame to open a new chart. If your desired currency pair is not listed, select the Symbol Chooser to alter your subscribed symbols list.
To view a specific chart from your open list, click on the time frame listed beneath the symbol in your Charts Window.
To delete a chart, select it in your Charts Window and hit the delete button on your keyboard, or right-click on the time frame and select Delete Chart.
The column next to Symbol will display trend Position. This will display Bullish, Bearish or Neutral, depending on your Bulls 'n Bears chart settings.
The Profit column will display your current open profit/loss for trades placed within that chart.
The PipCost will display the current value of each individual pip for that currency pair.
Spread Pips will tell you the current live pip spread, Spread Cost will tell you the amount the current pip spread costs.
Bid, Ask, High and Low values will be displayed for the current quote, as well as your Margin requirement.
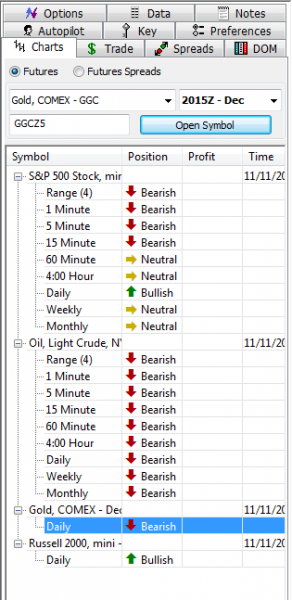 Futures users will select the commodity name from the Select Commodity window, followed by choosing this contract month, then clicking Open Symbol. Once opened, the commodity name and charting time frame will appear in the chart window. You may right-click the commodity name to open new time frames, or right-click the timeframe currently list to select and change to a new timeframe. To open a spreads chart, first select the Futures Spreads bullet at the top of the Charts window. You may then choose your two commodities and their contract months.
To view a specific chart at full screen, double-click on the symbol in your Charts Window, or right-click on the symbol and select Open Chart.
To delete a chart select it in your Charts Window and hit the delete button on your keyboard, or right-click on the symbol and select Delete Chart.
The column next to Symbol will display trend Position. This will display Bullish, Bearish or Neutral, depending on your Bulls 'n Bears chart settings.
The Profit column will display your current open profit/loss for trades placed within that chart.
Open, High, Low and Close values will be displayed for the current price bar in that charting time frame.
Daily Change will also show you the current percentage change in price for that day.
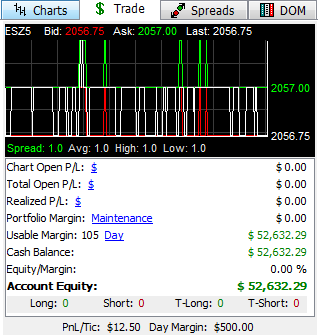
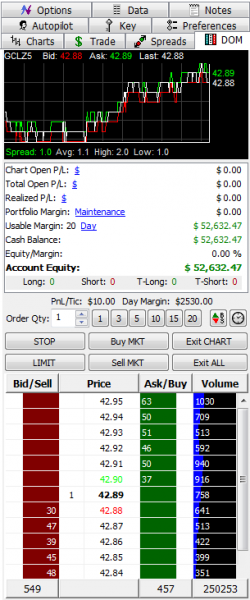
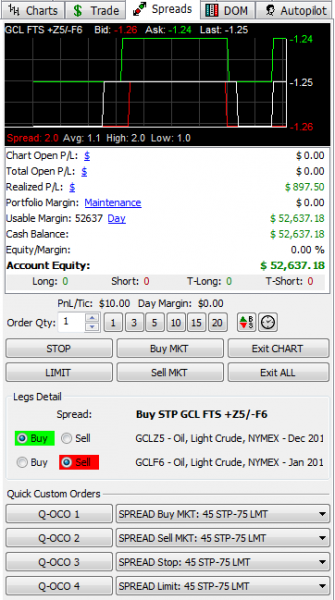
Quote Window: This will display the live quotes stream coming directly from the clearing house. The graph will display the Bid in red, the Ask in green, and the Last in white.
The top of the Quote Window will display the current contract symbol, the Bid(sell) price, the Ask(buy) price, and the Last(most recent) price.
The bottom of the Quote Window labels your current Spread(distance between bid/ask price), the Avg(Average) spread since opening this chart, the High, or largest spread since opening this chart, and the Low, or smallest spread since opening this chart.
Chart Open P/L: Will display your currently profit/loss(P/L) for contracts held in this specific symbol only.
Total Open P/L: Displays your current profit/loss for all open contracts held in all symbols.
Realized P/L: Displays your profit/loss for all trades that have closed.
*Note: Chart, Total and Realized P/L will display in dollar ($) value by default. Left-click the blue dollar sign $ to change to %ROM(Percent Return on Margin), Tics/Pips, or %Total (total account percentage gain/loss).
Portfolio Margin: Shows the currently used margin for all open contracts. You may left-click Maintenance which appears by default in blue to choose between viewing the Maintenance, Initial, or Day margin used.
Usable Margin: Displays the quantity of contracts you could create along with the account balance you still have available. You may left-click Maintenance which appears by default in blue to choose between viewing the Maintenance, Initial, or Day margin used.
Cash Balance: Balance available before closing currently open trades.
Equity/Margin: Equity/Margin Ratio is calculated by dividing current Account Equity (Net Liquidation Value) by the Portfolio Initial Margin Amount. If you want to place a trade or hold open positions, the Equity-to-Margin ratio in your account must be greater than 5%. If the Equity/Margin ratio drops below 5%, or the Account Equity drops below $500 (whichever comes first), your account may be locked by the clearing firm and/or open positions may be liquidated by the clearing firm in an attempt to prevent the account balance going negative.
Account Equity: Current account value including the dollar value of all open trades.
Long, Short, T-Long, T-Short: Will display the number of long or short contracts open in this symbol, or the total number of long or short orders (T-Long/T-Short) in all markets.
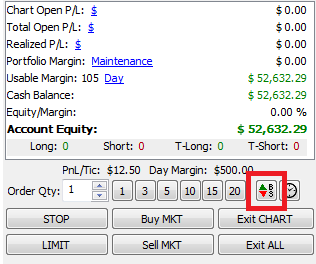
PnL/Tic: Displays the dollar value of each minimum move (tic/pip) for this open symbol. Day margin will also be listed as a quick reference.
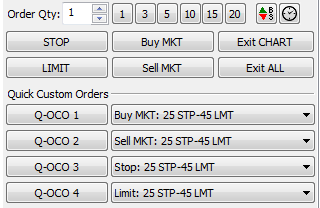 Order Qty: Here you select how many contracts you wish to create while using any of the order creation buttons listed below. You may type the order quantity into the window, click the up/down arrows to incrementally change the quantity, or you may click the quick order quantity buttons: 1 / 3 / 5 / 10 / 15/ 20.
STOP / LIMIT: Will attach a stop/limit order to your cursor as you move your mouse back into the chart window. Left-click within the chart window to create a new stop/limit order at the price selected.
Buy MKT / Sell MKT: Will create a new order to either buy or sell at the current market value.
Exit CHART: Will close all open orders in the symbol you are currently viewing, in Multi-Chart mode, verify symbol that is listed in the Quote Window.
Exit ALL: Panic button or just to end trading for the day, Exit ALL will close all orders(pending and filled), across all markets, immediately.
Quick Custom Orders: Filled by default with market or stop/limit entry orders which already have a profit taking and stop loss order attached. Left-click the Q-OCO 1 or Q-OCO 2 button to create a new market order with attached OCO(one cancels other) orders. Select Q-OCO 3 or Q-OCO 4 to attach a stop/limit order to your cursor with an attached profit-taking limit and stop-loss order. Once selected, click within the chart window to create the new order.
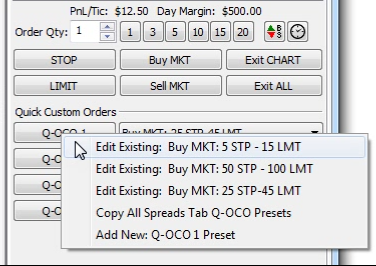
To edit the default Quick Custom Orders, right-click on the Q-OCO button you want to customize. From this window, you may select to Edit a previously created Q-OCO order, or you may Add New to create a new Q-OCO order.
Futures users may copy all Quick Custom Orders to their Spreads Tab from this same right-click window.
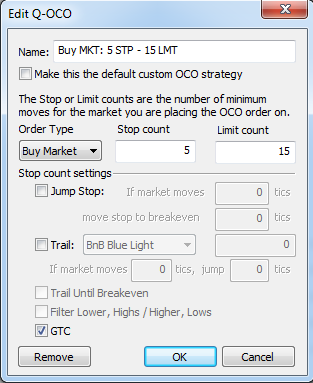 You may name or rename your Quick Custom Order to anything that you like, but it is recommended to include the order type and stop/limit values so that you may see your order type quickly at a glance when using the Q-OCO buttons.
If you want this order to appear by default for the selected Q-OCO button each time you open Track 'n Trade, make it your default custom OCO strategy by checking the box.
The Order Type will decide the entry order method. The stop count and limit count values will determine the distance away from your entry order that your stop loss and profit taking orders are created in tics/pips.
For more information about stop-loss customization, see the Place Order Button section [2].
Remove will delete this custom order from your Q-OCO menu.
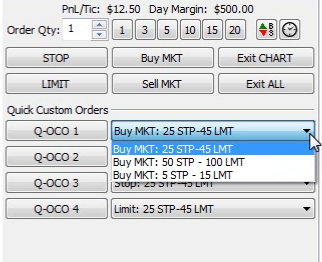
To choose between multiple saved Quick Custom Orders, left-click the order name and select your desired custom order from the drop-down window.
 The Order Placement Tool is used to place custom orders on the chart. Left-click on the red and green Buy/Sell button and then move your cursor into the chart window. The order is not placed until you left-click in the chart window and confirm the order from the Order Placement dialog. Note: to denote the Order Placement tool is in effect, the mouse's icon will change to an arrow.
This tool is also found in the Drawing Tools toolbar that runs across the top of the software.
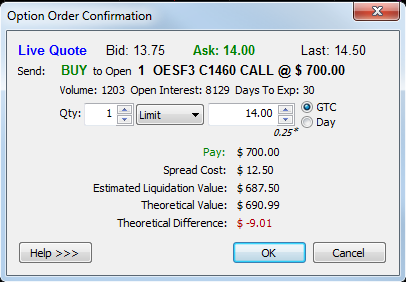
Order Placement dialog
To bring up the Order Placement dialog first select the Place Order button, then click in the chart approximately where you would like the order placed. At the top of the dialog, it will reflect the Contract/Currency Pair along with the rate at which the order was initially placed.
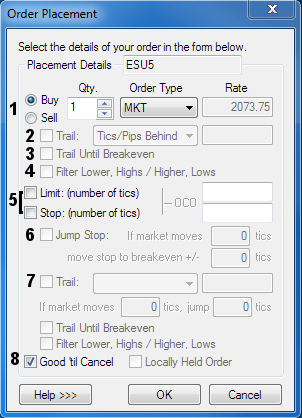
1. Order Details: Choose whether the order will be a Buy/Sell, what quantity (Qty.), Order Type, and the Rate.
Buy/Sell: Choose the appropriate radio button.
Qty: Either type in the quantity or use the up and down arrows.
Order Types:
Market Order (MKT): A market order does not specify a price; it is executed at the best possible price available. A market order can keep you from 'chasing' a market.
Market If Touched (MIT): Similar to a limit order, orders to buy are placed below the current price; orders to sell are placed above the current price. MIT orders fill once the limit price is touched or passed through. (Some exchanges do not allow MIT orders).
Limit Order (LMT): Limit Orders to buy are placed below the current price; limit orders to sell are placed above the current price. The market may touch a limit price several times, without filling. In most cases, the market must trade better than the limit for the order to fill.
Stop Order (STP): Place a buy stop order above the market price; place a sell stop order below the market price. A stop order becomes a Market Order when the specified price is reached.
Close Stop Order (C_STP): Place a buy close stop order above the market price; place a sell close stop order below the market price. A close stop order can only be a local order. A close stop order becomes a Market Order when the specified price is reached and the market closes lower(sell) or higher(buy) at the close of the bar.
Rate: When using a non-Market Order type, you can further adjust and edit your rate.
2. Trail: Make a Stop or Close Stop Order a trailing Stop or trailing Close Stop. Choose the trailing type in the drop-down menu and use the text box for the corresponding value of the trailing type.
% Open Profit: The stop order will trail the percentage specified times the profit of all open orders of the current symbol. In summary at (Percentage /100) * (Profit of Open Orders on this symbol). If the Open Orders Profit/Loss total is at a loss the stop will not trail.
$ Behind: The stop order will trail at the specified dollar amount.
# Price Bars: The stop order will trail at the highest high or lowest low within the specified amount of bars. A filter can be applied called Filter Lower, Highs / Higher, Lows. See below at number 4.
ATR Stop: The stop order will trail at the Average True Range Stop dots. Turn on the ATR Stop overlay to see where they are on the chart.
PSAR: The stop order will trail at the Parabolic Stop and Reverse dots. Turn on the Parabolic SAR overlay to see where they are on the chart.
Zig Zag: The stop order will trail at the Retracement Target. Turn on the Zig Zag overlay to see where it is on the chart.
BNB Blue Light: The stop order will trail at the Bulls n Bear Blue Light dots. Turn on the Bulls n Bears Blue Lights to see where it is on the chart. To do this go to the Preferences of Bulls n Bears and in the drop down under Blue Light choose Bullish/Bearish or Both.
Tics/Pips Behind: The stop order will trail at the specified number of tics/pips.
3. Trail Until Breakeven: This will enable your stop loss to trail until it reaches the price level of your entry order. Your stop order will then stop trailing and stay active at the break-even price level.
4. Filter Lower, Highs/Higher, Lows: This is a filter associated with the trailing Bars Back selection. This filter tells Track 'n Trade to only advance the trailing stop if the price bar makes a higher high on a long position or a lower low on a short position.
5. Limit and Stop (can be OCO): This will add a stop or limit at the number of tics/pips specified above or below the market (depends on the type of position). These will become a one cancels other (OCO) order when a stop and a limit are both selected.
6. Jump Stop: This will have the stop jump to a new tics/pips from breakeven (this can be negative to have it a certain tics/pips back from breakeven) after the market has moved favorably the specified tics/pips. This feature can be used when the order type at section 1 is a stop to make the first order to jump, or if using a stop in section 5 it makes that stop jump.
7. Trail Stop: This will enable the stop in section 5 to trail using the same features outlined in section 2.
8. Good 'til Cancel: This enables the order to be active until the user decides to cancel the order. If it is checked off the order will expire at the end of the trading day.
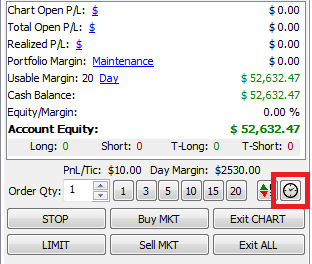
The Time Release Order Placement Button will appear within your Trade Tab as a clock face.
To create a time-released order, simply left-click this button.
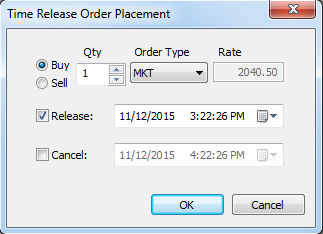 Once you have selected the Time Release Order Button, you may select to create a Buy or Sell order by selecting the bullet point in front of Buy or Sell.
Adjust your order quantity(Qty) by entering the number directly within the Qty window, or by clicking up or down in the Qty window.
The Order Type will appear as a Market (MKT) order by default, with your current market price shown within the Rate window.
Check the box in front of Release to create your order placement timer. You may then select what calendar date and time to place the trade in your market. *Note - Orders must have a release time during market hours to be accepted by the clearing house. Check your Key Tab for market hours and ensure that you are placing the trade during regular trading hours.
Click OK to create the order within your chart.
Cancel will be used to cancel orders that do not fill after a certain period of time. This will primarily be used with the addition of stop and limit entry orders in the near future.
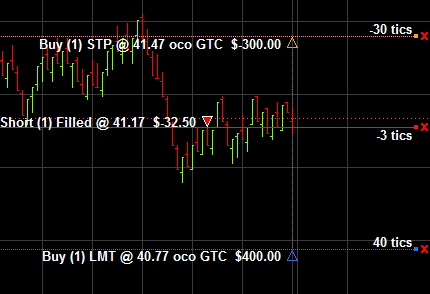 This section details how to adjust the appearance of orders, OCO's, and filled positions within your chart window. To adjust your order appearance, right-click any order/position triangle and select Properties.
Order: An unfilled stop or limit order.
One Cancels Other (OCO): Stop/Limit order attached to an entry order. When one stop/limit is triggered, the other stop/limit is canceled.
Position: Once an order fills, it becomes an open position.
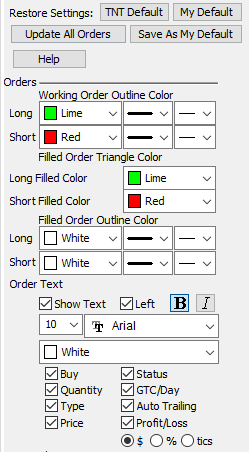
1. Restore Settings: TNT Default will change your settings back to the original software settings. My Default will change current settings to your personalized default settings. Apply To All Charts will apply your selected settings on all open charts. Save As My Default will save your current personal settings.
Working Order Outline Color: Adjust the appearance of a pending order triangle
Filled Order Triangle Color: Change the fill color of your pending order triangle
Filled Order Outline Color: Adjusts the triangle color outline after order fills.
Show Text: Hide/Display order text details
Left: Display order text to the left of the order triangle. Dependent on space requirements.
Font Size, Type, Color: Adjust the text size, font, and text color.
What information would you like displayed?: Check each item that you would like to have included with your onscreen text and if you would like values displayed in dollars ($), percent (%) or tics/pips.
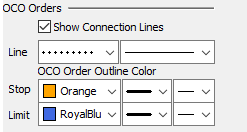
Show Connection Lines: Display lines connecting OCO's to entry order
Line: Adjust Connection Line appearance
OCO Order Outline Color: Adjust OCO stop/limit triangle color
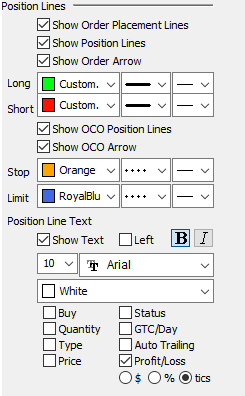
Position Lines: Display filled order position line, filled position lines and order triangle.
Long/Short Color: Alter filled position line color and appearance
OCO Position Lines: Display OCO position line and OCO position triangle
Stop/Limit Color: Adjust the OCO position line color
Position Line Text: Select whether to Show Text, have text display on the right or left-hand side of the position line.
What Position Information would you like displayed?: Display position line text for order details. Check each item that you would like to have included with your onscreen text and if you would like values displayed in dollars ($), percent (%) or tics/pips.
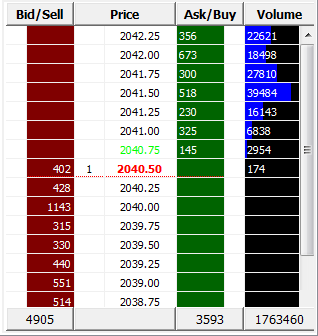 The DOM or Depth of Market is comprised of a multi-colored, multi-column trading tool, where the user can see a sliding scale of market prices and trading activity.
On either side of the market price scale, are columns, one representing the Bid, and the other representing the Ask. The Bid, or Sell side of the market is represented in Red, and the Ask side, or Buy side of the market is represented in green. The numbers listed within these columns display the number of trades waiting at each price. The numbers seen at the bottom total the values in the columns.
The market Volume column is on the far right of the price ladder, and represents the volume of contracts traded at that price, throughout that particular trading session, and highlights in blue the volume as a chart.
You may create trades directly from your DOM. Double-click a line within the Bid/Sell column to create a sell order at that specific price. Double-click a line within the Ask/Buy column to create a buy order at that specific price. Order quantity is determined by the Order Qty section directly above the DOM.
Quote Window: This will display the live quotes stream coming directly from the clearing house. The graph will display the Bid in red, the Ask in green, and the Last in white.
The top of the Quote Window will display the current contract symbol, the Bid(sell) price, the Ask(buy) price, and the Last(most recent) price.
The bottom of the Quote Window labels your current Spread(distance between bid/ask price), the Avg(Average) spread since opening this chart, the High or largest spread since opening this chart, and the Low or smallest spread since opening this chart.
Chart Open P/L: Will display your currently profit/loss(P/L) for contracts held in this specific symbol only.
Total Open P/L: Displays your current profit/loss for all open contracts held in all symbols.
Realized P/L: Displays your profit/loss for all trades that have closed.
*Note: Chart, Total and Realized P/L will display in dollar ($) value by default. Left-click the blue dollar sign $ to change to %ROM(Percent Return on Margin), Tics/Pips, or %Total (total account percentage gain/loss).
Portfolio Margin: Shows the currently used margin for all open contracts. You may left-click Maintenance which appears by default in blue to choose between viewing the Maintenance, Initial, or Day margin used.
Usable Margin: Displays the quantity of contracts you can create, along with the account balance you still have available. You may left-click Maintenance which appears by default in blue to choose between viewing the Maintenance, Initial, or Day margin used.
Cash Balance: Balance available before closing currently open trades.
Equity/Margin: Equity/Margin Ratio is calculated by dividing current Account Equity (Net Liquidation Value) by the Portfolio Initial Margin Amount. If you want to place a trade or hold open positions, the Equity-to-Margin ratio in your account must be greater than 5%. If the Equity/Margin ratio drops below 5%, or the Account Equity drops below $500 (whichever comes first), your account may be locked by the clearing firm and/or open positions may be liquidated by the clearing firm in an attempt to prevent the account balance going negative.
Account Equity: Current account value including the dollar value of all open trades.
Long, Short, T-Long, T-Short: Will display the number of long or short contracts open in this symbol, or the total number of long or short orders (T-Long/T-Short) in all markets.
PnL/Tic: Displays the dollar value of each minimum move (tic/pip) for this open symbol. Day margin will also be listed as a quick reference.
Order Qty: Here you select how many contracts you wish to create while using any of the order creation buttons listed below and while creating trades within the DOM. You may type the order quantity into the window, click the up/down arrows to incrementally change the quantity or you may click the quick order quantity buttons: 1 / 3 / 5 / 10 / 15/ 20.
To learn about the red/green Buy(B)/Sell(S) button, open the Place Order Button section. [2] To learn about the clock face button, open the Time Release Order Button section. [4]
STOP / LIMIT: Will attach a stop/limit order to your cursor as you move your mouse back into the chart window. Left-click within the chart window to create a new stop/limit order at the price selected.
Buy MKT / Sell MKT: Will create a new order to either buy or sell at the current market value.
Exit CHART: Will close all open orders in the symbol you are currently viewing, in Multi-Chart mode, verify symbol that is listed in the Quote Window.
Exit ALL: Panic button or just to end trading for the day, Exit ALL will close all orders(pending and open), across all markets, immediately.
The Preferences Tab is used to display the settings of the currently selected feature of the software. Once the Preferences Tab has been opened, left-clicking on any chart, tool, or indicator will immediately show the preferences for the selected item.
Chart Preferences
When you click on the chart with the Preferences Tab open, the Chart Preferences will appear. You can also right-click on the chart and select Chart Preferences. This is used to control how your chart looks. You can change your price bar style and color, background color, scaling, and even control time intervals. You can also choose to have different styles for each chart or apply your favorite chart style to all your charts.
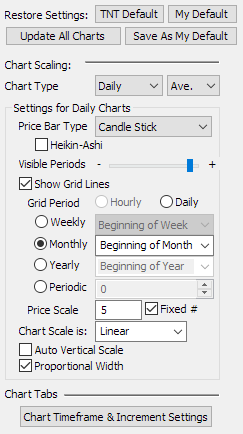
Chart Type: Sets the time interval each price bar will represent. You will have different grid options depending on what chart type you choose.
*Forex only: Drop-down menu next to the Chart Type to set the price bar according to the bid/ask.
Sell - bid
Buy - ask
Ave. - the average of the bid/ask
B & S - High of the ask and Low of the bid with the average Open and Close
Price Bar Type: Choose what information you want your price bar to include.
-OHLC: Open, high, low, and close.
-HLC: High, low, and close.
-Close: Close price only. Plotted as a line.
-Open: Open price only. Plotted as a line.
-Candlestick: open, high, low, and close in a -Japanese Candlestick style
-None: No price bars will be displayed on the chart
Heikin-Ashi: See here. [5]
Visible Periods: Scaling tool to show more or less bars in one window
Grid Period: Sets vertical grid lines at specific intervals. For example, if you have selected a 5, 10, 15, 30, or 60-minute chart type your grid period settings will be limited to hourly, daily, or periodic.
However, if you select a daily, weekly, or monthly chart type your grid period settings will be open to select any day of the week or month. You can also set your grid line to show daily, or at the beginning of each month, as well as select to show them periodic.
Price Scale: Sets the amount of horizontal price grid lines you see on your chart, these are equally spaced. If you want to see price grid lines at set intervals, uncheck Fixed, then select what price increments you want your grid.
Chart Scale: Linear will keep your grid lines evenly distributed. Logarithmic will continually decrease the amount of space between horizontal grid lines as the price goes up.
Auto Vertical Scale keeps the price bars vertically centered on your chart.
Proportional Width: changes price bar thickness according to scale
Chart Tabs
Chart Timeframe & Increment Settings: This button takes you to the Setup Chart Tabs Dialog [6]. You can set up custom time frames and different charts tab to be shown in the bottom left of the chart. You can also get to this dialog by right clicking on one of the chart tabs in the bottom left
Ruler Options
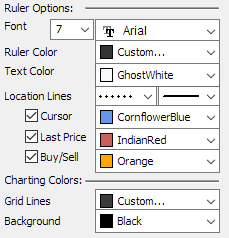
Font: Change the font and size of the text on the ruler.
Ruler/Text Color: Change the background and text color of the ruler.
Location Lines: Change the line style and thickness of your ruler lines.
Cursor, Last Price, Buy/Sell: Select if you would like to see cursor location lines, the last price line, or buy and sell price lines on your chart, and what color you would like them to be.
Grid Lines: Change the color of the horizontal and vertical grid lines.
Background: Change the chart background color.
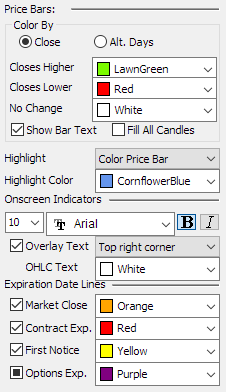 Color By: The price bars on your chart can be colored in two different ways
Close: shade them according to the close compared to the previous close price.
Alt Days: (alternating days) shade them by odd and even days.
Highlight: Choose between highlighting the price bar you are over or highlighting the entire day (bar) you are over. Hold down shift to quickly switch to the other option while your mouse is over the chart.
Change the font, size, and style of the text displayed onscreen for the overlays, indicators, and OHLC text.
Overlay Text: Select to display text for overlays, indicator, and OHLC on your chart. Then choose where you want this text to be displayed
OHLC Text: Choose the color for the OHLC text.
Expiration Date Lines: [Futures Only] Choose the color of the Market Close, Contract Expiration, First Notice, and Options Expiration timelines. Putting a check in the Options Expirations will show all options expiration times for that chart contract.
Total Net Position Line: [Forex Only] Choose the Color of the Total Net Position Line. This can be toggled on or off at View in the top left, then check on or off Show Total Net Position Line
 The Options tab may be viewed from the Control Panel on the right-hand side of the software. The Tab will appear as 'Options' with a turquoise and purple up/down arrow.
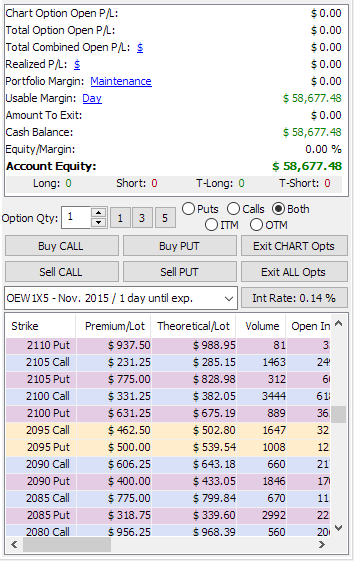
Once activated, your quick reference accounting information will be displayed at the top of the Options Tab. Here you will see your options profit/loss information along with required and available Margin. More information regarding your quick reference accounting information is available in the Trades Tab section. [7]
Options Orders
You will have access to create new buy/sell call and put options using the Buy/Sell CALL and Buy/Sell PUT buttons. You may close this charts options by selecting the Exit CHART Opts button. To close all options orders, select Exit ALL Opts.
Options Contract
Your options contract month may be selected in the drop-down window provided left of the Int Rate (Interest Rate) button. Use this Window to choose your chosen option contract month. Bolded contracts are monthly options.
Strike Price
The lower section of the Options Tab will show you the current market values for each available Strike price. Puts and Calls are colored to match filled option orders on the chart. Options at the money are displayed in a different color that correlates to the Bid/Ask lines color of Chart Preferences. You may also place orders using this window by right-clicking on your desired Strike level.
Columns: There are many columns in the Strike Price window for further Options analysis. Making the Options Tab wider will reveal these, or right-click on column titles and choose Column Setup. This will show the Options Strikes Table Column Chooser which includes short descriptions of each column and the option to turn on or off each of the columns.
Puts, Calls, Both, ITM or OTM: Use this feature to the right of the Option Qty buttons to toggle the Strike Price window to show only Puts, Calls, Both puts and calls, In The Money options (puts and calls), or Out of The Money options.
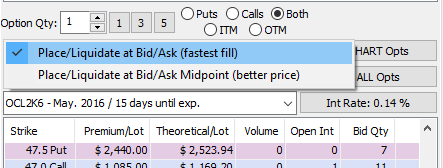 Options will fill by default at the current Bid/Ask (fastest fill). You may change this default to instead fill at the Bid/Ask Midpoint (better price). To apply this setting, right-click a Buy/Sell Call/Put button in the Options tab. The window on the left will appear and you may change to use the Midpoint price instead. You may also right-click the Exit CHART Opts and Exit ALL Opts to adjust this same feature for exiting trades.
Quickest Fill
To achieve the quickest possible fill:
- Buy a contract (i.e., bid for a contract) at the ask.
- Sell a contract (i.e., ask someone to buy a contract from you) at the bid.
Remember for quickest fill:
- When buying: your bid = market ask
- When selling: your ask = market bid
Best Price
To get the best possible price (as opposed to the quickest fill), enter at a different price than:
- If selling, the bid: to sell a contract, place an ask that is higher than the bid.
- If buying, the ask: to buy a contract, place a bid that is lower than the ask.
Remember for best price:
- When Buying: your bid < market ask
- When Selling: your ask > market bid
Days to Exp
Days left until the expiration of the option. The contract expires at the end of the 0th day until expiration.
Qty
The number of options contracts one is seeking to buy or sell.
Market Price
The current value of the option at a particular strike price.
Limit/Premium Value
When placing an options order, this is a modifiable value. This value changes according to its minimum move.
Note:
A limit/premium value further away from the current bid/ask/last is less likely to be touched in the short term.
GTC
An order that is Good 'Til Cancelled (GTC) will remain in the market until it is:
- canceled by the client
- executed in the market
- canceled because it has expired
Day
A Day option order is canceled at the current trading session’s market close if it has not yet been executed in the market.
Premium Minimum Move
The limit/premium of an option can change by certain increments. The amount of this increment is the premium minimum move.
Cost
If the option is on the buy side, then it will cost you money to acquire it.
Collect
If the option is on the sell side, then you will collect an amount of money if it is acquired.
Spread
The difference between the bid and the ask is called the spread.
Liquidate Value
The current value. Closing the option at the current value yields the liquidate value.
Premium
The price of the option.
Total Premium
Premium * quantity * 1 full point value of the underlying futures contract.
Theoretical Value
The calculated value of the option based on an options pricing model.
Volume
The number of transactions that have occurred for the given option symbol today.
Open Interest
The total number of options that are not closed or executed.
Option Symbol
OAUDV2 C100 is an example of an options symbol:
- OAUD is the symbol base, where AUD is the underlying symbol.
- V2 is the symbol for the month and year.
- C100 is the strike quote, a call at 100.
In order to load your options order preferences, right-click an options order diamond you have placed in your chart and select Properties.
There are three separate types of options orders. Options preferences are broken into these three separate sections. A Regular Option, a Pending-To-Close Option, and a To-Be-Closed(Original) Option.
Regular Option

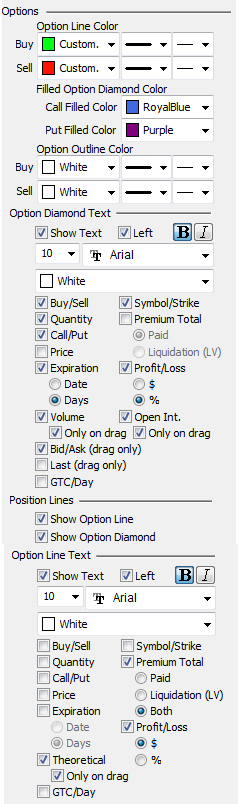
The first section of the options preferences will be dedicated to a regular option order placed within the chart window.
An example of a regular option order would be placing a Buy Call which fills above your market. You may customize colors based on whether it is a bought or sold option along with if it is a call or put option.
You will also be able to choose what on-screen text would be included with these trades. You can add descriptions which are as varied as Expiration, Premium, Volume.
Option Line Text
Will apply to any text descriptions that are added directly to the option line, which will appear locked on the left-hand side of your chart window.
Option Diamond Text
Will apply to any text descriptions which are attached directly to the options original diamond location.
Pending-To-Close-Option

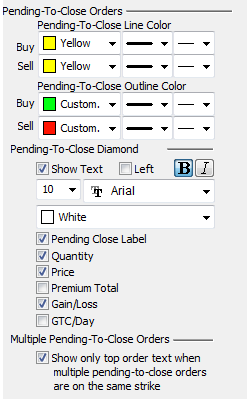
When you decide to liquidate an option, you can right-click on that option diamond and click Liquidate to create a new Pending-To-Close order.
If this order fills immediately, your options will close and no longer appear in the chart. However, if this new option does not immediately trigger from possibly a custom limit, then a new Pending-To-Close trade will be placed over the top of your To-Be-Closed Option.
By default, this pending order will appear in yellow, and it too will have appearance preferences that you may customize in the chart window.
To-Be-Closed(Original) Options

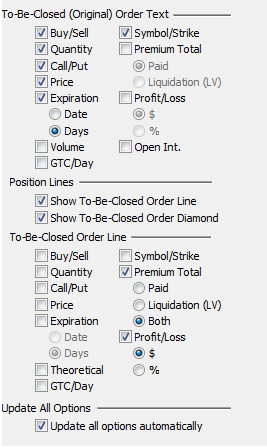
If you would like to see the To-Be-Closed(Original) Options in your chart window and it is being covered by a Pending-To-Close order, right-click on the yellow pending order's diamond and choose to Send to Back.
Once this Pending-To-Close order is sent to the background, you will see your original options order, which will now be displayed using the To-Be-Closed(Original) Order Text preferences.
It is this preferences section shown to the right that applies to To-Be-Closed(Original) Options.
Order Types (Buy, Sell, Open, Close):
When placing an options order, there are four types of option order that can be placed: Buy to Open, Sell to Open, Buy to Close, and Sell to Close. If a Buy to Open order is placed, then you are long that contract (call or put), which does not mean the same as being long an asset. Being long a contract simply means that you purchased the contract (i.e., you can be long both puts and calls). If a Sell to Open order is placed, then you are short that contract (i.e., you have simply sold an option, which can be either a put or a call). Buy to Close and Sell to Close orders, on the other hand, are simply orders that close out an existing option position. If you “Bought to Open” then you need to “Sell to Close,” but if you “Sold to Open” then you need to “Buy to Close.”
Definitions:
Buy to Open- An option order that establishes a new position that is long a particular contract.
Sell to Open- An option order that establishes a new position that is short a particular contract.
Buy to Close- An option order that closes out a previous position that was short a particular contract.
Sell to Close- An option order that closes out a previous position that was long a particular contract.
Prices (Bid, Ask, Limit, Market):
When placing an options order, you are allowed to specify various pricing criteria that specify how much you are willing to pay (or receive) for an options contract. Placing a Limit Order allows you to specify the maximum price that you are willing to pay (or receive) for a contract when you are buying (or selling) that contract. Placing a Market Order, on the other hand, specifies that you are willing to accept the market price, at the time the order is filled (not when the order was placed). The price that someone is willing to pay for a contract is called the Bid (when buying) and the price that someone is willing to accept for a contract is called the Ask (when selling). Lastly, the midpoint between the bid and ask is called the Bid-Ask Midpoint and the length between the bid and ask is called the Bid-Ask Spread.
Trader Tip:
When buying an option contract you will buy at the ask but when you are selling an option contract you will sell at the bid.
Definitions:
Bid - The price that a buyer is willing to pay for a given option contract.
Ask - The price that a seller is willing to accept for a given option contract.
Bid-Ask Midpoint - The price that is exactly in-between the best bid and best ask.
Bid-Ask Spread - The difference between the best bid and the best ask, currently in the market.
Market Order - An order that is to be executed as quickly as possible at the prevailing market price.
Limit Order - An order that guarantees that the price received is equal to (or better than) the price specified, but there is no guarantee that the order is executed.
Contract Terminology
Contract Specifications (Expiration, Exercise, Strike, Underlying, American, European):
An option is a contract that grants the owner of the option the right, but not the obligation, to purchase or sell an underlying asset at a pre-specified price, on or before a pre-specified date. The pre-specified price is called the Strike price (it is also known as the exercise price) and the pre-specified date is called the Expiration date (which is when you are able to Exercise your right to purchase or sell the Underlying asset that is specified in the contract). American options allow you to exercise the option on or before the expiration date. European options, on the other hand, only allow you to exercise the option on the expiration date.
Definitions:
Expiration - The day that the option contract expires.
Exercise - Invoking the rights associated with the option contract.
Strike - The price at which the contract can be exercised.
Underlying - The asset on which the option contract is based.
American - A type of option contract that gives the option holder the right to exercise the option on or before a specified date (this is not an indication of where the contract is traded).
European - A type of option contract that only allows for the option to be exercised on the expiration date (this is also not an indication of where the contract is traded).
Contract Types (Call, Put):
An option contract gives the option holder (i.e. the side of the contract that is long the contract) the right, but not the obligation, to buy or sell a pre-specified asset to the option writer (i.e. the side of the contract that is short the contract). An option contract that gives the holder the right to buy the underlying asset, at a predetermined price, is called a Call option, whereas an option contract that gives the holder the right to sell the underlying asset, at a predetermined price, is called a Put option.
Definitions:
Call Option - A contract that gives the buyer the right, but not the obligation, to purchase an asset at a predetermined price on or before the contract expiration date.
Put Option - A contract that gives the buyer the right, but not the obligation, to sell an asset at a predetermined price on or before the contract expiration date.
Column Setup in Options Chains
The following columns can be added to the Option Chain tab in the following views: Calls, Puts, Both, OTM, and ITM (Traditional View columns cannot be edited). To add/remove/edit columns in these views right click on any column header and select the Column Setup to see the following columns that can be added/removed:
Quote Window and Accounting information are available in the Trades Tab section. [7]
Order Qty: Here you select how many contracts you wish to create while using any of the order creation buttons listed below. You may type the order quantity into the window, click the up/down arrows to incrementally change the quantity or you may click the quick order quantity buttons: 1 / 3 / 5 / 10 / 15/ 20.
To learn about the red/green Buy(B)/Sell(S) button, open the Place Order Button section. [2] To learn about the clock face button, open the Time Release Order Button section. [4]
STOP / LIMIT: Will attach a stop/limit order to your cursor as you move your mouse back into the chart window. Left-click within the chart window to create a new stop/limit order at the price selected.
Buy MKT / Sell MKT: Will create a new order to either buy or sell at the current market value.
Exit CHART: Will close all open orders in the symbol you are currently viewing, in Multi-Chart mode, verify symbol that is listed in the Quote Window.
Exit ALL: Panic button or just to end trading for the day, Exit ALL will close all orders(pending and filled), across all markets, immediately.
Legs Detail: Will display the current buy market order details for your open spread chart. If you select to place a Stop, Limit or Q-OCO 3/4, this section will automatically update as you move your order placement cursor within the chart window.
This section displays the key details and data from the contract displayed in the Chart Window. (Terms are explained in depth in the Introduction to Futures [8] chapter.)
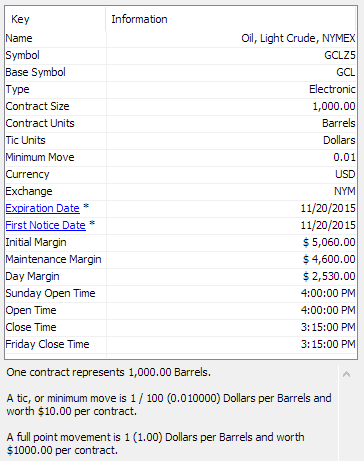
Name: Name of the commodity.
Symbol/Base Symbol: Gecko Software's symbol for the commodity.
Type: The type is a category for commodities.
Contract Size: Number of units that one contract represents.
Contract Units: The unit of measurement.
Tic Units: The unit of measure for quotes. This unit should be the same as the unit that the Exchange uses.
Minimum Move: The smallest increment the quote of a contract will fluctuate (a tic).
Exchange: The exchange is where the commodity's trades are processed.
Expiration/First Notice Date: Displays the important dates of the contract. Includes a link to the exchange about it.
Initial Margin: The required amount per contract you must have in your account to carry the open position from the current trading session (in which you opened the position) into the next trading session.
Maintenance Margin: The required amount per contract you must have in your account to maintain your open position in this contract from trading session to trading session. (The maintenance margin amount is typically calculated as 75% of the initial margin amount)
Day Margin: The required amount per contract you must have in your account to enter and exit a position within the same trading session, without having a position remain open over the market close. (The day margin amount is typically calculated as 25-50% of the initial margin amount depending on current market volatility)
Open and Close Times: Lists the Open and Close times for this contract in your time zone as listed in the File menu at Manage Time Zone.
Full Point movement: Below the table, the software shows how to calculate a full point movement. This value represents what a move in the one's place is worth.
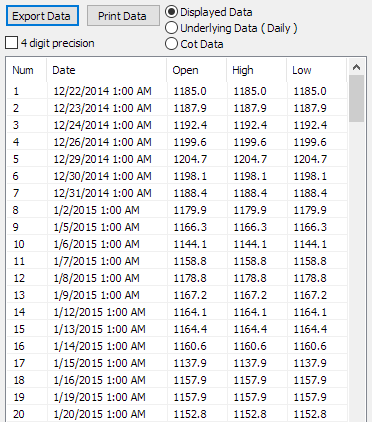
The Data Tab will show you the data for your current chart. It will give you the open price, close price, high price, and low price of the bars. It will also show the volume traded.
You have the option to print the data for your records or export the data for use another way.
Under displayed data, it will show the values for indicators or overlays that are currently on the chart. You may need to widen the control panel to see this.
In Futures, you can choose the CoT Data to see the details of the data for the Commitment of Traders indicator (only if you have the Commitment of Traders Plugin).
The Notes tab is for you to keep notes on the charts that are saved within your chartbook. Each chart has a new Notes section available to keep notes for that particular chart.
You can also put text right onto the chart using the text tool, you can find more information about that in Toolbars -> Standard Tools -> Text Tool [9].
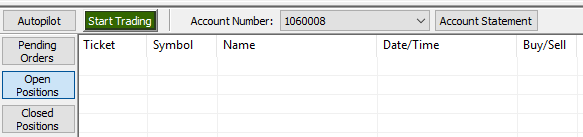
The Accounting Control Panel will appear in the lower left-hand corner of your Track 'n Trade Live software.
The Autopilot button may be selected to switch to the Autopilot Control Panel. You may return from the Autopilot by selecting the Accounting button in the same location.
The Start Trading button is used by the Autopilot to begin automated live trading. It is not necessary to click this button before manually trading any market.
Account Number: Will list which account you are currently trading. You may select the account name to toggle between multiple accounts when available. The Account Number listed will determine which account you are currently trading within Track 'n Trade.
Account Statement: Select this button to view your Account Statement online. This is available only while viewing a real money trading account.
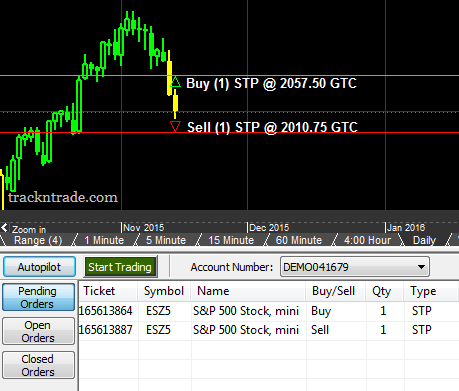 Pending Orders: Will display all orders which have not yet filled. This will include unfilled stop/limit orders, time release orders, and OCO orders.
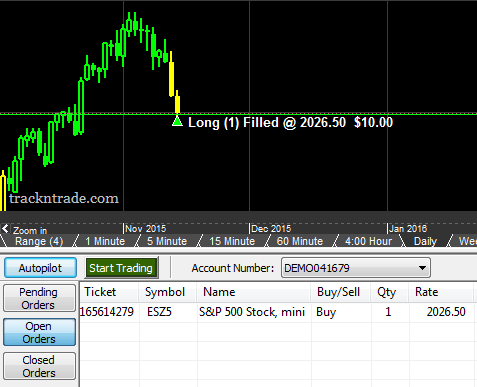 Open Positions: Will display all positions which are filled and actively being traded within your account.
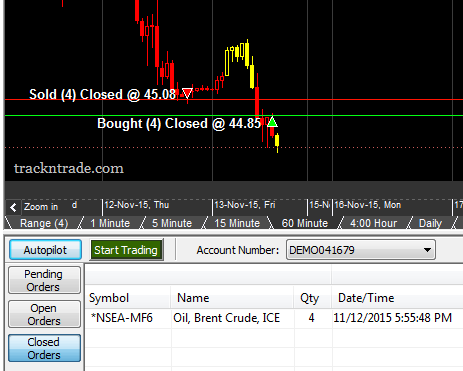 Closed Positions: Will display all positions which were filled and then closed out of the market. This section will also display any orders which were rejected by the clearing house.
Track 'n Trade will store your closed orders information for as long as the software remains open. If you close and reopen Track 'n Trade, you will only see all closed orders since the previous market close.
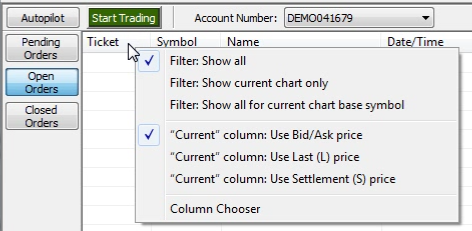 You may filter your trades list by right-clicking on any chart column such as Symbol, Name.
The default Filter: Show all will display orders from all contracts.
Your next option will be to display only the trades for the chart opened in the chart window.
The last Filter option will show all trades for the base symbol, and not just the contract opened within the chart window.
The "Current" options will determine how you want the Current column to list the market price.
The Column Chooser (*Futures only) may be selected to alter which columns are displayed within the Accounting Control Panel for that specific Pending, Open or Closed Orders section.
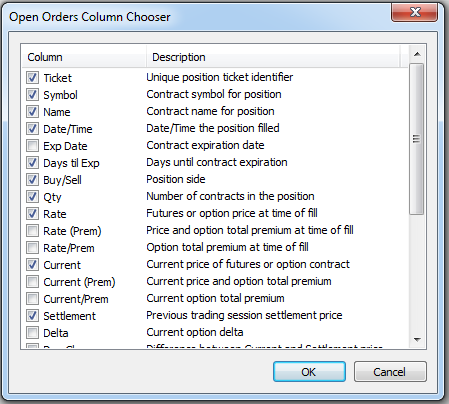 The Orders Column Chooser window includes a description of each column available, along with a check-box to activate/deactivate each.
After editing your list, click OK to save your new default Columns.
Links
[1] http://education.trackntrade.com/node/1312
[2] http://education.trackntrade.com/node/2043
[3] http://education.trackntrade.com/node/1311
[4] http://education.trackntrade.com/node/2044
[5] http://education.trackntrade.com/node/1775
[6] http://education.trackntrade.com/node/2034
[7] http://education.trackntrade.com/node/2042
[8] http://education.trackntrade.com/node/1209
[9] http://education.trackntrade.com/node/1261