
The seasonal markets are the commodities that began the futures industry. Wheat was the first commodity traded as a futures contract on the futures market. Commodities like Crude, Corn, Gold, Cattle, etc., have been around longer than financial commodities. Because they have been around longer, the seasonal commodities have more historical data. Being able to analyze that historical data gives you an advantage when you are trading a seasonal commodity.
The Seasonal Plug-In consists of three separate indicators listed below:
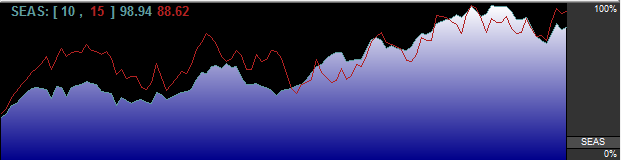
The seasonal trend indicator represents the "normal" historical behavior of the market. The indicator is calculated on the specific contract month, showing you the behavior of that specific chart. This is very important in agricultural markets with new and old crop contracts, such as Wheat or Corn.
The charts depict behavior on a relative basis; the actual prices are not forecasted, just the relative position of the market versus its contract high and low. On the seasonal charts, the high is depicted as 1.0, or 100%, while the low is depicted as 0.0, or 0%. All similar trading days are lined up for X number of years (the defaults in Track 'n Trade 5.0 are 10 years for Trend 1, and 15 years for Trend 2) and are analyzed in terms of where each day falls as a percentage of the highest and lowest price of either the last 12 months or the life of the contract for each specific contract. These prices are then averaged and depicted in the indicator window. When the trend line is at 100% or 1.0, it indicates where the contract has, on average, been at its highest value for a specified time range and scale period.
When the trend line is at 0% or 0.0, it indicates where the contract has, on average, been at its lowest value for the specified time range and scale period. The averages use data from all previous years and are not affected by the current year's trend.
To open the Seasonal Trend Indicator right click on the chart and select Add Indicator Window and then SEAS (Daily Charts Only) Seasonal Trend. Or right-click in an indicator window and select SEAS (Daily Charts Only) Seasonal Trend.
Open the Preferences Tab in your Control Panel. Select the SEAS quick link at the right of the indicator window. (Once you click on the chart, the Preference tab will go back to chart settings.)
Restore Settings: TNT Default will change your settings back to the original software settings. My Default will change current settings to your personalized default settings. Updates all SEAs will apply your selected settings on all open charts. Save As My Default will save your current personal settings.
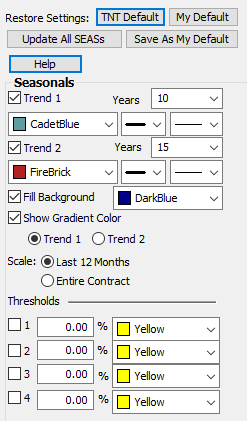 Trend 1,2: Select how many years you would like to view and what color, line thickness, and line style you would like the indicator to be. You can also choose
Fill background and choose the color and which trend you would like it to be applied to.
Show Gradient Color: Toggle gradient color shading on or off.
Scale: Decide if you would like the indicator to be based on the Entire Contract or the Last 12 Months.
Thresholds: View up to four thresholds at a value that you type in and a color that you choose.
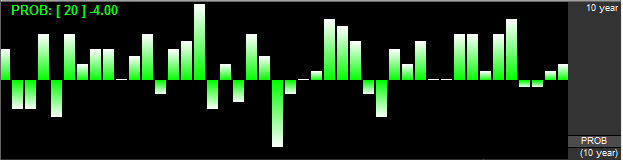
The historic Market Probability indicator shows the cumulative number of times the market in question has settled higher, lower, or the same on a specific date compared to the previous trading day's settlement price. For example, if you are looking at a five-year market probability indicator with a reading of +1, then the market in question may have historically settled higher three times and lower two times on this trading day than the previous trading day, or settled higher twice, lower once, and the same twice. The +1 reading is derived by subtracting the number of negative settlements from positive settlements, resulting in a net number of positive (+) or (-) settles. In other words, the +1 reading in these examples would be indicative of a market which has settled higher one more time than it has settled lower. If the market settled at the same price as the previous day, the total is not changed.
Displaying the Market Probability Indicator
Right-click in the indicator window and choose PROB - Market Probability. Or right-click on the chart and choose Add Indicator Window, then choose PROB - Market Probability.
Example of Market Probability
Preferences
To open the Market Probability Preferences click on the Quick Link (PROB) in the lower right of the indicator window. If you click on the chart, the Preferences tab will go back to chart settings.
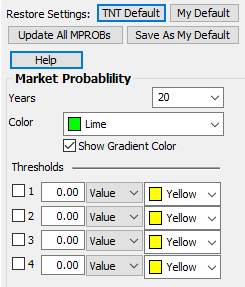 Restore Settings: TNT Default will change your settings back to the original software settings. My Default will change current settings to your personalized default settings. Update All MPROBs will apply your selected settings on all open charts. Save As My Default will save your current personal settings.
Market Probability: Select how many years you would like to view and what color you would like the indicator to be.
Show Gradient Color: Toggle gradient color shading on or off.
Thresholds: View up to four thresholds at a value that you type in and a color that you choose.
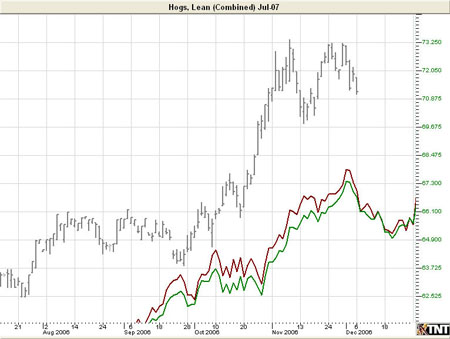
The Historical Average indicator is very similar to a Moving Average indicator, except that it is based on the average price of the specific contract lined up by date. The charts are made for specific contract months so that the trader can see the behavior of the specific contract they are looking at. This detail is important in a market with new and old crop contracts, such as the agricultural commodities.
Unlike the seasonal average prices, the Historic Average lines depicted in this feature are based on price, not a relative basis. In essence, what this feature does is give you the average price on a specific day. This chart will have the same basic feel and theme as the seasonal chart, except instead of prices being scaled on a relative basis (0 to 100%) they are the average historical price for that day.
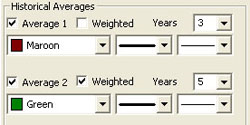
This feature helps traders to quickly see how current prices compare versus average historical prices over a given time period and also shows seasonal trends over the given historical years chosen. By simply checking the Average 1 and/or Average 2 checkbox(s) on within the Historical Averages chart overlay properties, it displays the average line(s) within the main chart window. You may also change the number of years, the color, and line style in which the indicator is displayed. The weighted box can be selected to provide more significance to the latter years than the earlier years. The un-weighted is a simple average, giving equal significance to each year included in the study.
To open the Historical Averages overlay right click on the chart and select Chart Overlays and then Historical Averages.
To open the Historical Averages Preferences click on the QuickLink (HIST) in the lower right of the chart. Or you can right-click, select Overlay Properties and then Historical Averages. If you click on the chart, the Preferences tab will go back to chart settings.
 Restore Settings: TNT Default will change your settings back to the original software settings. My Default will change current settings to your personalized default settings. Update All HISTs will apply your selected settings on all open charts. Save As My Default will save your current personal settings.
Historical Averages: Select which averages you would like to view, if you would like them Weighted, and how many years you would like to see. Choose the color, line style, and line thickness of your indicator line.